Bank Nifty gapped down, hit support, bounced, but reversed sharply later - ICICI Direct

Nifty : 24768
Technical Outlook
Day that was…
* Equity benchmarks ended slightly lower amid US tariff of 25%+ penalty on India and settled the session at 24768, down 0.35%. Market breadth was in favor of declines, with an A/D ratio of 1:2 where broader markets underperformed the benchmark. Midcap and Small cap closed on a negative note down ~1%. Sectorally, barring FMCG all indices closed in red. Where, Oil & Gas, Pharma and Metal underperformed.
Technical Outlook:
* Despite gap-down opening tracking anxiety around tariff, index managed to hold 24500 levels as a result it formed a small bull candle with large upper wick indicating, supportive effort from lower levels. The bias remains corrective amid lackluster earnings, continuous FII’s selling coupled with depreciating rupee which has reached to a five-month low trading near 87.50 levels.
* Going ahead, we expect bias to remain corrective as long as Nifty maintains lower-high-low formation. Nifty has been sustaining above key support of 24500 despite geopolitical worries seen during past three-months. Hence, only a decisive close below 24500 would result into extended correction wherein strong support is placed at 24200 being confluence of 200 days EMA coupled with 38.2% retracement of entire rally seen off April lows of 21743. Meanwhile, to pause the on-going corrective move, index need to decisively close above previous session high that would open pullback options towards 25300 in coming weeks.
* Key monitorable to watch out for in current volatile scenario:
* a) Depreciating Rupee, as USD/INR is currently trading at 5 months low of 87.5.
* b) On the global macro front, US Dollar index and Crude oil has seen minor pullback. However, it is important to watch out how its pans out once the anxiety around tariff settles down.
* c) India Vix has staged rebound from cyclical low of 10, indicating rise in volatility going ahead.
* On the broader market front, breach of past three weeks low on Midcap and small cap indices indicates corrective bias wherein possibility of mean revision towards its short-term averages cannot be ruled out. In addition to that, the market breadth has seen deterioration as % of stocks above 50 days SMA have declined to 38% from last week’s reading of 68%.
Nifty Bank : 55962
Technical Outlook
Day that was...
* The Bank Nifty closed on a negative note, settling at 55,962 down 0.34%. The Nifty Pvt Bank index outperformed the benchmark, ending at 27119 with a margin loss of 0.13%, suggesting broader sectoral consolidation with selective strength.
Technical Outlook:
* Bank Nifty opened with a gap-down but found support near the lower trendline of its prevailing channel, triggering a mid-session recovery; however, the inability to sustain higher levels led to a sharp intraday reversal and a close below the previous session's low, forming a small bearish candle with wick in either side.
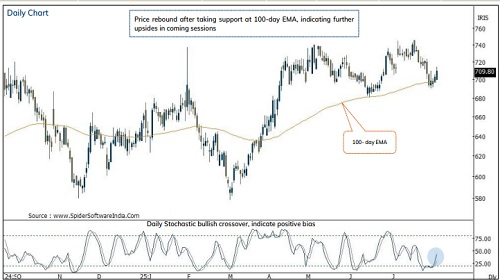
* Key point to highlight is that, The Nifty Bank Index continues to respect a well-established ascending channel pattern since late April 2025, maintaining a higher-high, higher-low structure despite intermittent geopolitical issues. A brief knee-jerk reaction to tariff-related developments was absorbed at the channel support near 55,400, with additional downside protection offered by the 100-day EMA at 54,875. Going forward, the index is likely to remain in a consolidation phase beneath the key resistance zone of 57,250 a level that has been repeatedly tested, indicating a firm horizontal ceiling. A decisive breakout above 57,250, supported by volume expansion, would gradually challenge its All Time High placed around 57600 levels and eventually accelerate up move towards 58800 levels in the coming quarter which is the implied target of the consolidation from (56098-53483). Additionally, the daily Stochastic oscillator has bounced from oversold territory at 23.43, indicating a potential exhaustion in selling pressure.
* Since April, intermediate corrections have remained shallow while the index has consistently held above its 100-day EMA. Moreover, over the past eleven weeks, the index has retraced 50% of the preceding 8.50% up move seen in the prior five weeks. The slower pace of retracement highlights a robust price structure, which augurs well for the next leg of the uptrend. Consequently, any dip from current levels could offer fresh buying opportunities as immediate support is placed near the 54750 zone which is 50% retracement level of its preceding rally and confluence with 100-day EMA base support.
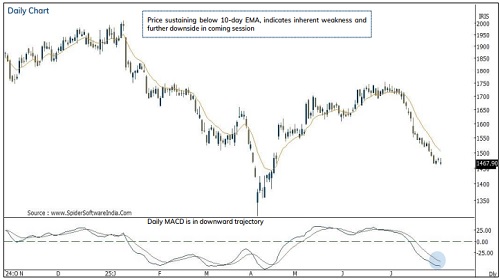
* The PSU Bank Index underperformed the broader market, forming a small bearish candle with wicks on both ends and closing below its 50-day EMA a key support held since May. However, a rebound from the 6,800 zone, which marks the confluence of a rising trendline, prior breakout level, and the 100- day EMA, suggests a potential base formation that could support a renewed upside. While Bank Nifty consolidates within 3% of its all-time high, PSU Banks lag 13% below theirs, presenting a catch-up opportunity. The index remains in a higher-high-low structure (as per Dow-theory) post its breakout on May 19, with immediate support at 6,700 aligned with the 20-week EMA.
* Structurally, the index is undergoing a time-wise correction rather than a steep price correction, which is a constructive sign in the context of a prevailing uptrend. The formation of higher base patterns near the keymoving average support zone, along with subdued retracements, implies that stronger hands are utilizing dips to accumulate
Please refer disclaimer at https://secure.icicidirect.com/Content/StaticData/Disclaimer.html
SEBI Registration number INZ000183631


.jpg)
More News

Daily Derivatives Report 11th March 2026 by Axis Securities Ltd