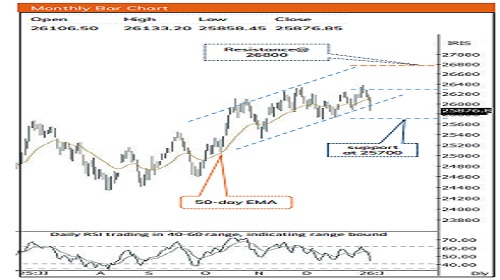
Index opened lower, fell for fourth day, but found 20-DMA support - ICICI Direct

Nifty :25876
Technical Outlook
Day that was…
The equity benchmark concluded the session on a negative note tracking subdued global cues to settle at 25876 down 1%. Market breadth remained negative with an A/D ratio of 1:5. Broader markets has relatively underperformed the benchmark with both Nifty Midcap and Smallcap declined 2% each. the On the sectoral front, all indices closed in a negative territory wherein Metals and Oil&Gas remained the top loser.
Technical Outlook:
* The index opened on a flat note and witnessed follow through decline below previous session low and closed around its 50-day EMA. The daily price action formed a sizeable bear candle carrying lower-high-low intraday structure, indicating intraday pullback were short-lived.
* Index extended its lower-high-low pattern for fourth-consecutive session, indicating corrective bias. However, it is important to highlight that Since Oct 2025, Index has witnessed an intermediate correction to the tune of ~3% with not more than five-consecutive negative close. In the current phase, the index has already corrected ~2% followed by four-consecutive negative close, mirroring past cycles which makes us believe the ongoing correction is nearing price and time maturity. However, to pause the ongoing corrective phase a decisive close above previous session high would prerequisite and would help index to gradually resolve higher towards 26300, being upper band of ongoing consolidation range (25700-26300).
* Structurally, the index witnessed strong resilience during the May–August 2025 phase by consistently holding above its gap support, highlighting robust base formation. This constructive setup eventually helped index to resolve higher. In the current scenario as well, the index continues to sustain above the gap support established in November 2025, mirroring the earlier structural pattern. This alignment with past price behavior suggests the potential emergence of a fresh leg of upward momentum in the coming month. (Refer 3rd slide for detail technical view)
* In the process, bouts of volatility owing to global development and onset of earning season would present incremental buying opportunity wherein strong support is placed at 25700 being lower band of ongoing consolidation range.
Key Monitorable for the next week:
a) Q3-FY26 earnings b) US court ruling on tariffs
Intraday Rational:
* Trend- Lower high-low structure
* Levels: Sell near 61.8% retracement of previous session range
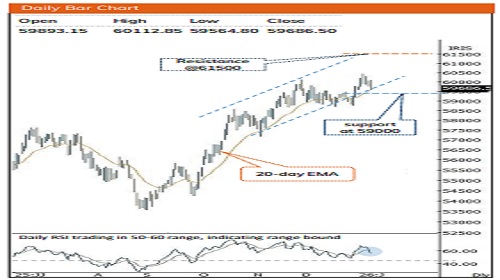
Nifty Bank : 59687
Technical Outlook
Day that was:
Bank Nifty ended the day on a negative note, at 59687 down 0.5%. Nifty PSU Bank Index extended the decline down 2.1% whereas Nifty Private Bank was in line with benchmark down 0.4%.
Technical Outlook:
* Index opened on a negative note and decline for fourth consecutive day however witnessed supportive efforts from 20-day EMA.The daily price action formed bear candle with upper shadow, indicating profit booking at higher levels.
* Key point to highlight is that, Bank Nifty extended its breather for fourth-consecutive session, however holding firm above its key short moving average support, indicating supportive efforts in the vicinity of 20-day EMA. The formation of lower high-low signifies corrective bias. Hence, to pause the ongoing corrective phase, a decisive close above previous session high would be necessary to pause the ongoing corrective phase that would eventually help index to resolve higher towards 61500. Meanwhile immediate support is now placed at 59000 being 80% retracement of current up move(58737-60437)
* Structurally, Index has retraced its entire 4-weeks decline in a single week, while clocking a fresh all-time high, indicating faster pace of recovery.
* Nifty PSU Bank Index witnessed profit booking for second consecutive sessions and formed lower high -lower low. We expect Index to consolidate in the range 8400-8850 in coming weeks and eventually head towards 9200 in month of January
Intraday Rational:
* Trend- Formation of lower high-low signifies corrective phase
* Levels: Sell near 61.8% retracement of previous session range
Please refer disclaimer at https://secure.icicidirect.com/Content/StaticData/Disclaimer.html
SEBI Registration number INZ000183631


.jpg)