Commodity Weekly Insights 04 Mar 2026 : Gold Report by Geojit Investments Ltd

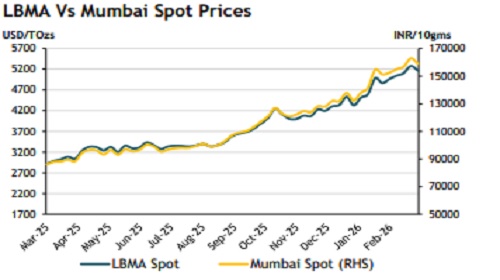
Gold spot briefly tested above $5400/oz
Gold prices resumed a steady upward trajectory after the sharp liquidation seen in late January and early February. LBMA spot prices briefly climbed above USD 5,400 per troy ounce in the first week of March and retreated, driven by a significant escalation in geopolitical tensions after the United States and Israel launched major strikes in Iran that killed Supreme Leader Ayatollah Ali Khamenei. Iran’s subsequent retaliation, including attacks on U.S. bases in the Middle East and strikes that damaged tankers and severely slowed traffic through the crucial Strait of Hormuz, fuelled a surge in safe haven demand for bullion.
Total gold demand in 2025, including OTC activity, surpassed 5000 tonnes for the first time. Coupled with a record-setting gold price, which hit 53 new all-time highs during the year, this drove the total market value to an unprecedented USD 555 billion, a 45% year on year increase. Investment activity was the primary driver of this growth. Global gold ETF holdings expanded by 801 tonnes, marking the second strongest annual increase ever, while bar and coin demand surged to its highest level in 12 years. Central banks added 19 tonnes of gold in December 2025 based on IMF and other public sources, bringing full year reported net purchases to 328 tonnes, slightly below the 345 tonnes recorded in 2024.
Momentum continued into the new year, with global investors increasing allocations to physically backed gold ETFs. In January, gold ETFs saw inflows of USD 19 billion, the strongest monthly intake on record. Combined with a 14% rise in gold prices, these inflows pushed global ETF AUM to a record USD 669 billion, up 20% for the month. Total global holdings grew by 120 tonnes to reach a new all-time high of 4145 tonnes
Fed meeting awaited, no cuts expected The U.S. Federal Reserve left interest rates unchanged at 3.50%–3.75% in its January meeting. Meanwhile, no rate cut is expected at the March meeting, as the Federal Reserve continues to prioritize containing inflation and sees limited evidence that price pressures are easing quickly enough to justify policy easin
China’s Gold consumption declined for a second year in 2025 China’s gold consumption declined for a second straight year in 2025, falling 3.57% to 950.096 tonne. Jewellery demand dropped sharply by 31.61% to 363.836 tonne, reducing its share to 38% of total consumption. In contrast, bar and coin purchases rose 35.14% to 504.238 tonne. Overall, the drop in jewellery buying exceeded the rise in bar and coin demand by 37 tonne.
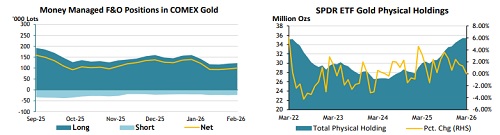
SPDR gold backed ETFs Physical holdings in in February SPDR gold-backed ETF holdings increased in February by 1.31%, posting nine consecutive months of inflows. This follows increases of 1.54% in January and 2.40% in December. As of February 2026, the SPDR Gold Trust held 354.08 million ounces of physical gold.
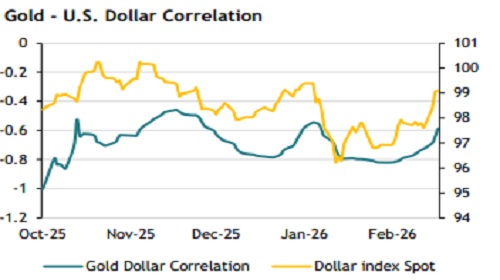
Gold-US dollar correlation The correlation between gold and the U.S. dollar has turned negative, suggesting that a decline in the dollar could provide upward momentum for gold.
Outlook
Gold prices are likely to remain supported by steady central bank buying and firm ETF inflows, with ongoing geopolitical tensions in Middle East adding further support. However, a sharp rebound in the U.S. dollar and expectations of a potential shift in U.S. monetary policy under the new Fed Chair have tempered gains. Once the current phase of volatility eases, the market is expected to refocus on the structural factors that drives bullion demand in the longer period.
Technical View
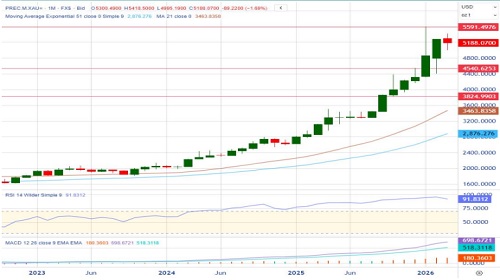
London Spot: The MACD bullish divergence points to positive market sentiment, while the RSI in overbought territory signals the potential for continued profit-taking and liquidation. Prices are likely to remain range bound, punctuated by occasional spikes in volatility. Meanwhile, a sustained break below the USD4880 support zone could indicate growing downside risks.
MCX: Sustaining the upward momentum would require strong, volume driven trades above the Rs.170,000 level. Conversely, a decline below the Rs.157,000 region could heighten the probability of further downside pressure
For More Geojit Financial Services Ltd Disclaimer https://www.geojit.com/disclaimer
SEBI Registration Number: INH20000034