Bank Credit Growth to Taper as Funding Sources Diversify by CareEdge Ratings

Synopsis
• Non-food bank credit growth remained strong at 17.4% year-on-year (y-o-y) in May 2026, up from 9.0% a year ago, reflecting broad-based improvement across key sectors. On a sequential basis, credit growth was supported mainly by higher lending to the industrial and services sectors.
• The services sector continued to record the strongest growth, expanding by 20.4% y-o-y, marking the sixth consecutive month in which it outpaced other major sectors. The sustained momentum was led by robust lending to NBFCs. At the same time, industrial credit also strengthened further, supported by higher borrowing from large corporates, MSMEs and infrastructure-related sectors. The recent increase in bank lending also reflects a shift in funding preferences, as higher bond yields have made debt market borrowings relatively less attractive (corporate bond issuances declined by 57.0% month-on-month (m-o-m), and commercial paper (CP) outstanding fell by 4.4% m-o-m), prompting borrowers to rely more on bank financing.
• Within retail credit, personal loans remained resilient, supported by vehicle finance and continued strength in gold loans, while credit card growth moderated further.
• Looking ahead, bank credit growth is expected to remain healthy in FY27, supported by improving liquidity conditions, sustained government capital expenditure, and steady domestic economic activity, although the growth is likely to gradually normalise from the recent elevated pace. The RBI's measures to encourage FCNR(B) deposits are expected to strengthen banks' liability profile by improving deposit mobilisation and funding availability. Separately, lower hedging costs for eligible ECB borrowers, together with softer G-sec yields, are expected to encourage greater use of ECBs and domestic debt markets by large borrowers, reducing their reliance on bank borrowings. Consequently, bank credit growth is expected to moderate gradually as funding preferences increasingly shift towards market-based sources.
Figure 1: Continued Uptick in Gross Bank Credit Growth (y-o-y, %)
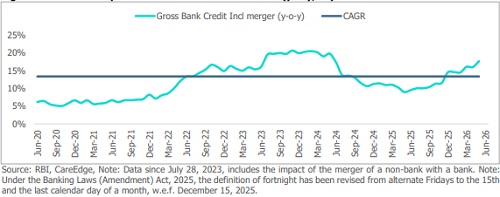
Figure 2: Broad-Based Credit Growth Sustains Momentum Across Key Segments (y-o-y, %)
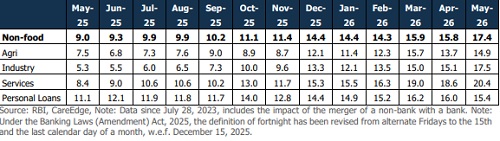
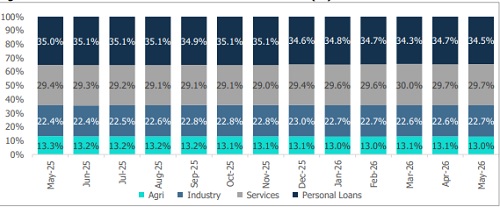
Bank credit growth remained broad-based in May 2026, with non-food credit expanding by 17.4% y-o-y. The services sector continued to record the fastest growth, driven by robust lending to NBFCs and commercial real estate (CRE). Industrial credit gained further traction, rising 17.5%, reflecting improving credit demand from infra and large corporates. At the same time, personal loan growth remained resilient at 15.4% y-o-y in May 2026, although it moderated slightly from 16.0% in the previous month. Credit to agriculture sustained its double-digit growth trajectory at 14.9%. Gold loans registered an increase of 105.5% y-o-y increase, supported by higher gold prices, although the pace of growth moderated compared with the previous month, partly due to a higher base effect.
Figure 3: Personal Loans Continue to Dominate the Credit Mix (%)
Industry Sustains Momentum
Figure 4: Sequential Rise in Large Industry Share
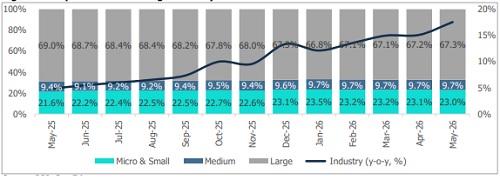
Figure 5: Bank Lending to Large Industry Figure 6: Infrastructure Credit Maintains Continues to Recover (y-o-y, %) Double Digit Growth (y-o-y, %)
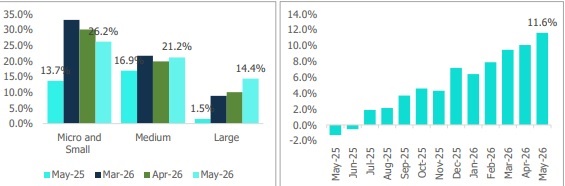
Credit to large industries continued to improve, with growth rising to 14.4% y-o-y in May 2026, compared with 1.5% a year ago. The recovery reflects higher borrowing by large corporates, particularly in the engineering, metals, chemicals, power, and transport sectors. While MSME credit remained strong, growth moderated from recent highs, though it continued to outpace growth in large and medium enterprises, supported by healthy domestic demand and government-backed credit.
Infrastructure credit maintained its upward trajectory, with growth accelerating to 11.6% y-o-y in May 2026, extending the double-digit expansion witnessed over recent months. The recovery has become increasingly broadbased, supported by sustained public capital expenditure, which increased to Rs 2.51 lakh crore in YTDFY27 from Rs 2.21 lakh crore during the corresponding period last year, reflecting a 14% y-o-y increase alongside the continued execution of large infrastructure projects. The power sector, which accounts for more than half of total infrastructure credit, remained the key growth driver, rising 23.8% y-o-y. This was supported by continued capacity additions across the power sector, as gross installed generating capacity increased by 63.0% y-o-y and 12.5% mo-m in May 2026, driven by investments in renewable energy, transmission networks, and thermal power projects.
Credit to ports also remained exceptionally strong, grew by 82.8% y-o-y, reflecting ongoing capacity expansion and logistics investments. At the same time, overall infrastructure lending benefited from continued financing of roads, urban infrastructure and industrial projects. However, lending to telecommunications, airports and railways remained relatively weak; their smaller share limited the overall impact on infrastructure credit.
Going forward, Industrial and infrastructure credit are expected to remain well supported over the coming quarters. The Government's continued focus on capital expenditure, manufacturing expansion and energy transition, together with healthy project pipelines, should sustain demand for long-term financing. Freight activity also remained resilient, with cargo handled at major ports increasing by 2.4% y-o-y in April 2026, while registering a ~4.7% CAGR over the past two years, indicating continued momentum in trade and logistics. However, the pace of bank credit growth will also depend on financing conditions in the corporate bond market, as lower bond yields could encourage corporates to raise a larger share of their funding through debt issuance.
Services Sector
Figure 7: NBFCs Sustain their Market Share (%)
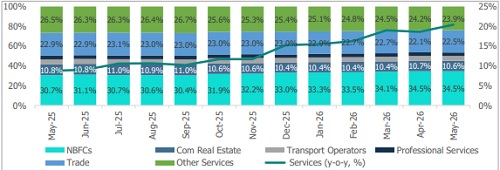
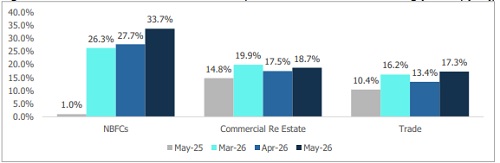
Credit to the services sector remained the strongest among major segments, expanding 20.4% y-o-y in May 2026, up from 8.4% a year ago. The growth was supported by robust lending to NBFCs, trade and CRE, with NBFCs continuing to account for a larger share of services-sector credit.
Figure 8: NBFCs Drive Incremental Credit Growth, Amid Shift Towards Bank Funding (Growth, y-o-y,)
Above views are of the author and not of the website kindly read disclaimer