Accumulate Shree Cement Ltd For Target Rs.27,907 by Prabhudas Liladhar Capital Ltd
Volumes rebound; pricing gap rectified; will it sustain?
Quick Pointers
* Management guided for ~40mt cement volumes in FY27
* Total cost inflation of ~INR150-200/t is expected in Q1FY27
SRCM reported inline std operating performance in Q4FY26, led by strong volume growth of 9.5% YoY and blended NSR growth of 3.7%QoQ (cement NSR up 1.6%QoQ). Improvement in NSR was driven by price hikes, efforts on narrowing pricing gap with leader over last one year and higher premium product share. Freight costs increased due to increase in lead distance by 12km QoQ while other expenses declined on higher operating leverage. RM/t was higher but P&F costs were inline on fuel inventory, supported by higher RE share at 61% and improved thermal efficiency. This led to EBITDA/t of INR1,161 (PLe INR1,156/t). Going ahead, management has guided for ~40mt cement volumes in FY27 (~9-10% growth), while near-term costs are expected to increase by ~INR150-200/t in Q1FY27 due to higher fuel and packaging costs.
SRCM has also curtailed FY27 capex from Rs30bn (Q2 concall) to Rs15bn as mgmt. is aligning with industry peers to improve its utilization (66% in Q4). It is prioritizing its North-East market entry with 1mtpa IU in the first phase and intends to increase to ~4mtpa in subsequent phases. In the existing key markets, pricing is now almost stabilized (with reduced gap with the leader) and mgmt. would focus on improving volumes at this pricing driving profitability. Execution on this balanced strategy remains a key monitorable going ahead. Near-term fuel and packaging cost pressures are expected to persist, making price hikes and cost optimisation critical for margin protection. SRCM’s strong balance sheet, cost leadership and rising renewable energy share should continue to support earnings resilience. We tweak our FY27/28E EBITDA estimates by -3/+2% factoring in higher cost assumptions. At CMP, the stock is trading at 17.2x/15x FY27/FY28E EV/EBITDA. Maintain ‘Accumulate’ with a revised TP of INR27,907 (earlier INR27,370), valuing the stock at same 17x Mar’28E EV/EBITDA.
Other important points:
* Cement realisation improved to INR4,725/t in Q4FY26 vs INR4,652/t in Q3.
* Capacity utilisation improved sharply to 66% in Q4FY26 in busy season.
* Lead distance increased by 12km QoQ to 457km in Q4FY26.
* RMC revenue stood at ~INR0.9bn in Q4FY26 and ~INR2.46bn in FY26.
* Fuel cost stood at ~INR1.6/kcal in Q4FY26 and may rise to ~INR1.76-1.80/kcal.
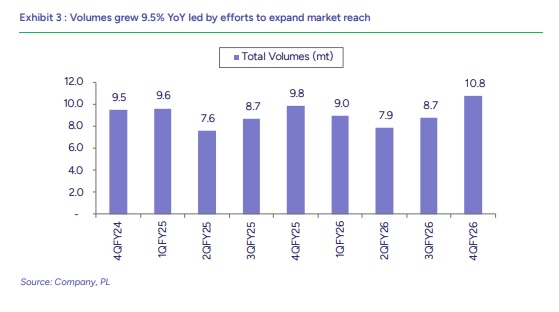
Strong revenue growth on higher prices and volumes: Std. revenue increased 7.7%YoY to INR56.4bn (+28%QoQ; PLe INR54.8bn) on strong volumes and higher cement prices. Cement & clinker volumes grew 9.5%YoY to 10.77mt (+23%QoQ; PLe 10.63mt) led by efforts to expand market reach. Blended NSR grew 3.7%QoQ to INR5,240/t (-1.6%YoY; PLe INR5,154/t) led by increase in cement prices in the Eastern region, reduced pricing gap with leader and increase in premium share to 22% vs 16% in Q4FY25.
EBITDA declined YoY on higher operating costs: Blended EBITDA/t was INR1,161/t (-17%YoY/+10.7%QoQ) vs PLe INR1,156/t. EBITDA declined 9.5%YoY to INR12.5bn (-36.4%QoQ; PLe INR12.3bn). P&F costs/t declined 1.1%YoY to INR1,159/t on higher RE share to 61% (59% in Q4FY25). Freight cost/t grew 6.6%YoY to INR1,252/t. RM costs/t increased 33.7%YoY to INR761/t. Other expense/t declined 10.6%YoY to INR664/t. PAT declined 4%YoY to INR5.3bn (+91%QoQ; PLe INR5.9bn).
Q4FY26 Conference Call Highlights:
Outlook / Strategy
* Management highlighted that India’s macro environment remains supportive, backed by government spending on roads, railways and infrastructure.
* However, geopolitical tensions in the Middle East and moderate monsoon expectations remain near-term risks for the sector.
* Management highlighted that cement demand elasticity to GDP has moderated from ~1.3x earlier to ~1-1.1x currently due to implementation of new GDP series.
* SRCM reiterated that it remains focused on balancing profitability, pricing discipline and market share recovery.
Demand / Volumes / Pricing
* SRCM has taken ~INR25/bag price hikes across regions, which management believes should largely offset near-term cost pressures.
* Management highlighted that the pricing gap with the industry leader has narrowed from ~INR50/bag to ~INR15-20/bag over the past few quarters.
* Management guided for ~40mt cement volumes in FY27 and expects SRCM to grow ~1% ahead of industry growth. Cement industry demand growth is expected at ~7-7.2% in FY27, while SRCM is targeting ~8% growth.
* Cement realisation improved to INR4,725/t in Q4FY26 vs INR4,652/t in Q3FY26.
* Capacity utilisation improved sharply to 66% in Q4FY26 from 56% in Q3FY26. Regional utilisation stood at North 70%, East 60% and South 61%.
* Trade sales stood at 64%, while blended cement at 62%. Premium product share increased to 22% from ~15% two years ago.
* Management reiterated that profitability remains the key focus and the company will not aggressively chase volumes through price wars.
Costs / Fuel / Efficiency
* Landed fuel cost stood at ~INR1.6/kcal in Q4FY26 and is expected to increase to ~INR1.76-1.80/kcal in Q1FY27 due to inch up in pet coke prices.
* Total cost inflation of ~INR150-200/t is expected in Q1FY27, driven by fuel and packaging costs. Packaging costs alone are expected to increase by ~INR80-100/t.
* Total costs increased by only ~INR20-30/t in Q4FY26 (mainly PP bags) compared to Q3FY26.
* Fuel mix for Q4FY26 stood at 54% pet coke, 32% coal and 14% alternative fuels.
* Thermal efficiency improved, with heat consumption reducing to ~733kcal/kg from ~741kcal/kg QoQ.
* RE share increased to 61% in Q4FY26 vs 59% in Q4FY25. Total green power capacity stands at 666.5MW. All current and upcoming kilns will be linked with WHRS facilities.
* Management continues to focus on railway sidings, AFR, RE, WHRS and thermal efficiency to improve cost competitiveness.
* Lead distance increased by 12km QoQ to 457km in Q4FY26, impacting freight costs. Management expects lead distance to reduce to sub-440km over time.
* Clinker factor stood at 64.8% in Q4FY26 vs 63.9% in Q3FY26.
* Coal inventory remains above 90 days. Management also highlighted that fly ash is not the only cementitious material being explored for blended cement.
Capex / Expansion
* SRCM commissioned its 3.65mtpa clinker and 3.5mtpa cement capacity at Kodla, Karnataka, taking total cement capacity in India to 69.3mtpa.
* The 2.5mtpa GU at Union Cement (UAE) remains on track for commissioning by Sep’26. Union Cement’s performance improved significantly during FY26 on the back of robust demand and better pricing.
* The company is setting up a 0.95mtpa clinker and 0.99mtpa cement plant in Meghalaya. SRCM has secured three limestone blocks under state’s mine allocation policy, with the first block estimated to contain ~600mt limestone reserves.
* Meghalaya project capex is estimated at ~INR18bn, with significant infrastructure investments being front ended for future expansion. The company ultimately intends to scale the region to ~4-4.5mtpa capacity over time.
* FY27 capex guidance stands at ~INR15bn, largely towards RMC expansion, railway sidings and Meghalaya expansion.
* RMC network expanded from 26 plants at FY26-end to 36 plants currently after commissioning 10 new plants in Mar’26. Management expects RMC plants to increase to ~50-55 by FY27-end.
* RMC revenue stood at ~INR0.9bn in Q4FY26 and ~INR2.46bn in FY26.
* Management reiterated its long-term target of reaching 80mtpa capacity by FY29, although expansion pace has been moderated considering the current industry environment.
Please refer disclaimer at https://www.plindia.com/disclaimer/
SEBI Registration No. INH000000271