

Yearly Technical Outlook & New Year Picks - 2026 by Axis Securities

Global Market Recap 2025: Global Equities & Precious Metals Take the Lead
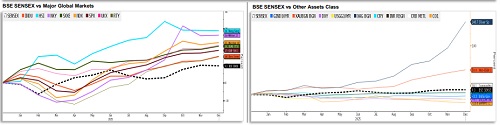
Indian Equities Lagged Peers, while Global Markets and Precious Metals Delivered Outsized Gains
* Global equities outperformed Indian equities in 2025, with the Sensex up a modest (+9.3%) amid mixed domestic cues.
* US markets remained strong, led by the Nasdaq (+22.1%), S&P 500 (+17.9%), Dow Jones (+14.5%), and Russell 2000 (+14.3%), while Japan’s Nikkei surged (+26.4%) and Hong Kong’s Hang Seng topped the charts with a (+28.7%) rally.
* Europe joined the upswing, with the Euro Stoxx (+20.2%) and UK FTSE (+20.8%) posting solid gains.
* Across asset classes, precious metals outshone equities, with Silver soaring (+148.7%) and Gold gaining (+50.0%), reflecting strong demand for inflation hedges.
* A softer US Dollar DXY (-9.6%) and a sharp decline in crude oil prices WTI (-16.6%) supported risk sentiment, while USD/INR depreciated (+4.9%) over the year.
BSE Sector Performance in 2025
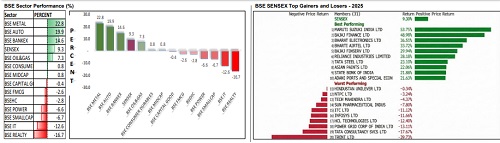
Selective Sector Rally: Divergent Trends Mark 2025 Market Performance
* In contrast to 2024’s broad-based rally, 2025 saw divergent sectoral performance, with select cyclicals outperforming while defensives and growth segments lagged.
* BSE Metal (+22.8%), BSE Auto (+19.9%), and Bankex (+14.6%) led the gains, significantly outperforming the Sensex.
* BSE Realty (-16.7%) and BSE IT (-12.9%) were the weakest sectors, followed by Power, Consumer Durables, FMCG, and Healthcare. BSE Midcap (+0.8%) and Smallcap (-6.7%) reflected limited participation from broader market segments.
* The Sensex rose (+9.3%), with gains concentrated in a few stocks. Top performers included MARUTI, BAJFINANCE, and BEL, while TRENT, TCS, and POWERGRID underperformed.
* Overall, market participation remained narrow and selective, highlighting a cautious risk appetite despite pockets of strong sectoral rallies.
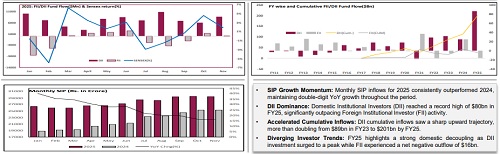
Institutional Flow Dynamics Drive Volatility, Stability, and Market Momentum
* FII Volatility: FIIs showed high volatility, with heavy net outflows in January, February, and August. The largest net inflows occurred in April, May, and June, signalling frequent sentiment shifts.
* DII Steady Support: Domestic Institutional Investors (DIIs) provided uninterrupted net buying (inflows) across all months (Jan-Nov). Their strong support in January, June, August, and November consistently countered FII selling pressure.
* Market Swings: The Sensex saw its steepest drop in February (approx. -5.9%). The strongest gains were registered in March and October, fueled by major FII/DII buying.
* Late-Year Momentum: After the July–August dip, markets regained positive momentum between September and November, supported by record DII inflows in August. This liquidity cushion enabled the Sensex to gradually recover from the ~3% decline recorded in July.

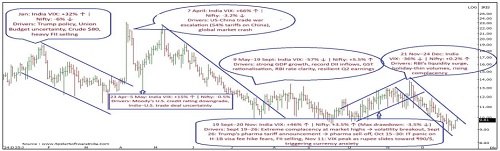
Navigating the Volatility in 2025 with India VIX
2025 Market Review: From Global Panic to Domestic Calm
* Volatility Shock: Global Risk Events (January–April) – India VIX surged on Trump inauguration risk, Budget uncertainty, and the April 7 US–China trade war shock. Sharp FII selling and global equity sell-offs dragged Nifty lower despite strong domestic fundamentals.
* Normalisation: Domestic Strength Takes Over (May–September) – As worst-case global scenarios faded, volatility collapsed, and markets stabilised. Strong GDP growth, record DII inflows, and RBI rate clarity drove a steady Nifty grind higher.
* Event-Led Spikes: Year-End Complacency (September–December) – Pharma tariffs, H-1B IT visa fears, and rupee weakness caused brief volatility spikes without trend damage. RBI liquidity, thin holiday volumes, and renewed foreign inflows pushed India VIX to record lows.
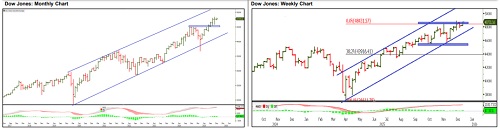
Dow Jones Technical Outlook: Bullish Structure Remains Intact
Structural Uptrend Intact; Breakout Signals Continued Upside Momentum
* The US Dow Jones Industrial Average (DJIA) has been trading within a rising channel since Mar’20, signalling a sustained medium-term bullish trend. In Apr’25, the index found strong support at the lower band of the channel and has since rebounded, with momentum now pointing toward the upper band near the 52,500 level.
* The index registered a decisive breakout above its previous all-time high of 45,071 in Aug’25, post which it delivered a robust 8% upside, underscoring strong bullish conviction. On the downside, the prior resistance zone around 45,000 is now expected to act as a key support, in line with the principle of polarity.
* Additionally, the Monthly MACD holding firmly above the zero line reinforces the view of persistent upward momentum
AI-led Rally Under the Lens: Bubble Risks Assessed - Insights from Technical Analysis
Tech-7 Leadership Intact Despite Near-Term Correction; 23,850 remains critical support.
* NDX Long-Term Bullish, Short-Term Cooling: The NASDAQ 100 (NDX) remains in a long-term uptrend, with the weekly chart showing profit booking toward the 23% Fibonacci retracement of the rally from Apr’25, driven by caution in AI-heavy tech stocks. The move appears orderly and corrective. The index is expected to hold this support; a break below could extend the decline toward the 38% Fibonacci at 22,500, while a breakout above the all-time high at 26,182 would confirm trend continuation.
* Tech 7 – Strong Trend, Short-Term Counter Correction: The top seven tech heavyweights—Nvidia, Microsoft, Apple, Alphabet, Tesla, Meta, and Amazon—collectively account for nearly 60% of the NDX weight. All stocks, except Meta, continue to trade above their 200-day SMA, keeping the long-term trend intact. Five names are positioned above the 100-day SMA, while six are holding above the 50-day SMA, indicating a strong primary trend despite short-term corrective phases.
* Market Breadth – Strength Beneath the Surface: Breadth remains supportive, with 61% of stocks above the 200-day SMA and 57% above the 50-day SMA, signalling healthy participation despite near-term cooling.
* The NDX trend is expected to remain bullish in the long term, with the current counter-trend correction acting as a healthy reset, supported by leadership strength and constructive market breadth.
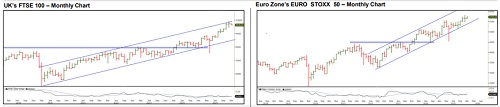
Europe in Focus: FTSE at Record Highs, Euro Stoxx Leads on Relative Strength
UK’s FTSE 100 Breakout: Bullish Outlook Above 8,000 Support
* The UK FTSE 100, on a monthly chart, surged past the psychological 9,000 barrier in Jul’25, transforming old resistance into a formidable support zone. Since this definitive breakout, the index has maintained aggressive momentum, delivering a robust 20.8% return in 2025. The uptrend remains structurally sound as the index targets the 10,000 milestone, currently trading near all-time highs.
* The RS (Relative Strength) line measures the performance of an asset relative to a benchmark, indicating whether it is outperforming or underperforming the comparison index. The RS Ratio line of the FTSE 100 against the Dow Jones Industrial Average (DJIA) continues to slope downward, suggesting that the FTSE will likely underperform the DJIA.
Eurozone's Euro Stoxx Index Breakout: Bullish Momentum Above 5500
* EURO STOXX 50 Index successfully broke above its long-term horizontal resistance (the 4,500 level) in early 2024, confirming a bullish structural shift as it rallied toward the 5,800 mark. Following this breakout, the index established a well-defined ascending channel, maintaining a strong upward trajectory throughout 2024 and 2025. This move delivered a significant double-digit return while establishing firm support above the 5,500 mark. The uptrend remains intact as long as the index sustains its position within this rising channel, signalling continued strength heading into 2026.
* The RS-Ratio line against the DJIA has transitioned to an upward tilt in late 2025, indicating that the Euro Stoxx is now outperforming the DJIA. This positive shift in relative strength, paired with the price breakout, confirms that the Eurozone benchmark has reclaimed its lead over its US counterparts for the current cycle.
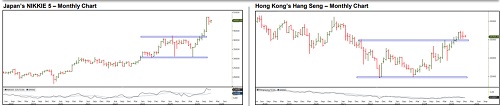
Asia Reasserts Leadership: Nikkei at Record Highs, Hang Seng Breaks Multi-Year Range
Japanese Nikkei 225 Outlook: Bullish Breakout Above Major Resistance
* The Nikkei 225 Index, on a monthly chart, decisively broke above the 40,000 resistance level in early 2025, which has now transitioned into a significant support zone. Following a period of consolidation throughout 2024, the index entered a parabolic phase in late 2025, delivering an exceptional 26.4% return for the year. The uptrend remains robust as the index trades at historic highs, with the 50,000 level now serving as a new psychological floor for future gains.
* The RS (Relative Strength) line broke above its downward-sloping consolidation channel in mid-2025 and is currently trending sharply upward. This indicates that the Nikkei 225 is significantly outperforming the DJIA, reclaiming its status as a leading global performer.
Hang Seng’s: Structural Breakout Signals a New Leadership Cycle
* The Hang Seng Index decisively broke above its multi-year consolidation range of 14,500–23,000 in early 2025, signalling a major shift in market sentiment. Building on its late 2024 recovery, the index maintained strong upward momentum throughout the first three quarters, delivering an impressive 28.7% YTD gain in 2025. Despite some late-year volatility and a brief retest of support near 26,000, the index continues to trade at levels not seen in years, currently holding near the 25,600 zone.
* The RS (Relative Strength) line against the Dow Jones Industrial Average (DJIA) has successfully broken its flat consolidation and is now sloping upward. This indicates a period of clear outperformance for the Hang Seng Index relative to its global benchmarks
For More Axis Securities Disclaimer https://simplehai.axisdirect.in/disclaimer-home
SEBI Registration number is INZ000161633


More News

Quote on Evening Markets 27th November 2025 by Mr. Vikram Kasat, Head - Advisory, PL Capital


