Quant-Funda : Buy between Rs. 860–900 Shyam Metalics & Energy Ltd For Target Rs. 1,120- Geojit Investments Ltd

Fundamental View
Shyam Metalics & Energy Ltd (SMEL), is primarily focused on long steel products and ferro alloys, operating across the full steel value chain with a diversified portfolio from iron pellets to TMT bars, wire rods, structural products, and stainless steel. Its recent foray into aluminium foil and other value-added products positions it as a key supplier to industries including infrastructure, construction, automotive, and packaging.
* Revenue grew ~ 21%YoY to Rs.13,312cr in 9MFY26 led by strong volume growth and new capacity contributions.
* EBITDA grew ~19% YoY to Rs.1,606cr in 9MFY26 while EBITDA margins contracted by 20 bps YoY to 12.1% vs 12.3% in 9MFY25 due to higher raw material costs (coal, iron ore) and lower realisation in core steel products. Consequently, PAT grew by ~9%YoY to Rs. 749cr in 9MFY26.
* Q4FY26 is expected to see stronger margins, supported by rising domestic steel prices, seasonal construction demand, and recent product price hikes that help offset raw material costs, setting a solid base for FY27 growth.
* Capex of ?6,660cr will be undertaken over the next 2–3 years to expand steel and aluminium capacities, add captive power and downstream facilities, and strengthen the product mix.
* As per market consensus, SMEL is trading at 1 yr fwd EV/EBITDA of 8.8x (which is ~22% above to its 3 yr avg EV/EBITDA of 7.2x), supported by high growth expectations from capacity expansions, backward integration, and increasing value-added products.
Technical View
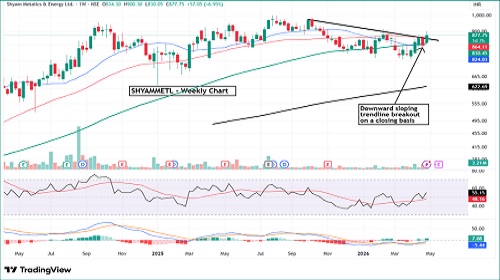
* A decisive breakout above the downward-sloping trendline on a closing basis signals easing selling pressure and a positive change in short- to medium-term trend dynamics.
* Price is trading around its key short- and medium-term moving averages, with early signs of these averages flattening to turning upward, suggesting improving trend alignment.
* The RSI has moved higher toward the mid-to-upper zone, indicating gradual improvement in momentum without signs of overextension. The MACD is showing signs of recovery with a flattening histogram and potential crossover, reflecting waning bearish momentum and emerging strength.
* The setup presents a favourable risk-reward profile, with support around ?760 and upside potential toward Rs.1,120, making it suitable for a breakout-driven positional trade .
For More Geojit Financial Services Ltd Disclaimer https://www.geojit.com/disclaimer
SEBI Registration Number: INH200000345


.jpg)