Oil and Gas Sector Update : India's gas demand down 1.5% YoY in Jul'25, post 8.5% YoY fall in 1QFY26 By JM Financial Services Ltd
India’s gas demand down 1.5% YoY in Jul’25, post 8.5% YoY fall in 1QFY26
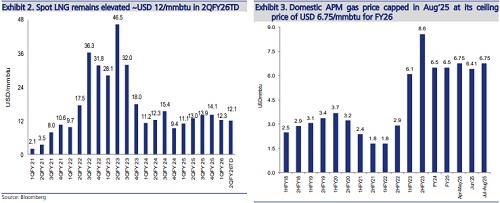
India’s LNG demand recovered 2.1% MoM in Jul’25 at 99.6mmscmc but was still down 1.5% YoY due to elevated spot LNG prices, while domestic gas demand was lower 2% MoM at 92.1mmscmd. Hence, the country’s gas demand was flattish MoM and still down 1.9% YoY in Jul’25 at 194mmsmcd. However, CGD sector total gas demand increased MoM to 45mmscmd in Jul’25 (vs. 43.7mmscmd in Jun’25). Asian spot LNG price remained elevated ~USD 12/mmbtu or 17% of Brent (vs. historical average of ~12% of Brent) led by Europe’s sustained restocking demand (EU gas inventories are currently at 76%, below 1-year prior level of 91% and 5-year average of 83%) amidst limited addition to LNG export capacity. Sustained high spot LNG price could continue to be a near-term concern for all gas companies, particularly for CGD companies like Gujarat Gas (given its 20-30% dependency on spot LNG). Further, this can impact domestic LNG demand and, hence, volume for Petronet LNG, GAIL and GSPL. However, we expect likely moderation in spot LNG prices in the medium to long term due to significant 40-50% addition in global LNG supply capacity in 5-6 years starting 2HCY26.
* India’s total gas demand flattish MoM and still down 1.9% YoY in Jul’25 led by continued muted LNG demand on elevated spot LNG prices: India’s Jul’25 total gas demand was flattish MoM and still down 1.9% or 3.7mmscmd YoY, at ~194mmscmd (vs. ~194mmscmd in Jun'25, but still below 197mmscmd in Jul'24), led by continued muted LNG demand on elevated spot LNG prices. On a YoY basis, the decline of 3.7mmscmd or 1.9% in Jul'25 gas demand was primarily led by the refinery (down 2.9mmscmd, probably due to lower alternate fuel prices) and fertiliser (down 2mmscmd, probably due to few plant shutdowns) segments, though that was partly offset by higher gas demand from the CGD segment (up 4.4mmscmd). However, on a MoM basis, gas demand was flattish as decline in gas demand from the petchem (down 2.8mmscmd) and power (down 1.8mmsmcd) segments was mostly offset by rise in gas demand in CGD (up 1.3mmscmd), refinery (up 0.9mmscmd), fertiliser (up 0.6mmscmd) and other segments – Exhibit 14-20.
* India’s LNG demand recovers 2.1% MoM but still down 1.5% YoY in Jul’25 due to elevated spot LNG prices: LNG demand recovered 2.1% MoM but was still down 1.5% YoY in Jul'25 at 101.6mmscmd (vs. 99.6mmscmd in Jun'25, but still below 103.2mmscmd in Jul'24) due to elevated spot LNG prices at USD 12-14/mmbtu during Jun-Jul'25 or 17-20% of Brent vs historical 12%. On a YoY basis, the decline of 1.5mmscmd in Jul'25 LNG demand was led by fertiliser (down 5.5mmscmd), petchem (down 1.8mmscmd) and refinery (down 1.5mmscmd) segments, though that was partly offset by higher LNG demand from CGD (up 3.5mmscmd) and power (up 2.6mmscmd) segments. However, on a MoM basis, LNG demand recovered by 2.1mmscmd on rise in gas demand from refinery (up 2.2mmscmd), CGD (up 1.7mmscmd) and fertiliser (up 0.8mmscmd) segments, though that was partly offset by decline in gas demand from petchem (down 2.0mmsmcd) and power (down 1.6mmsmcd) segments.
* Domestic gas demand lower MoM at 92.1mmscmd in Jul’25: Domestic gas demand was lower MoM at 92.1mmscmd in Jul’25 (vs. 94.4mmscmd in Jun’25 and vs. 94.2mmscmd in Jul'24). During Jul’25, the MoM decline of 2.3mmscmd in domestic gas demand was led by: a) Refinery sector (2.6mmscmd in Jul’25 vs. 4.0mmscmd in Jun’25); b) Petchem sector (4.5mmscmd in Jul’25 vs. 5.3mmscmd in Jun’25); c) CGD sector (27.6mmscmd in Jul’25 vs. 28.0mmscmd in Jun’25); d) Power sector (14.9mmscmd in Jul’25 vs. 15.1mmscmd in Jun’25); and e) Fertiliser sector (8.8mmscmd in Jul’25 vs. 9.0mmscmd in Jun’25). However, this was slightly offset by rise in domestic gas demand in other segments.
* India’s CGD sector total gas demand increased MoM to 45mmscmd in Jul’25: India’s CGD sector total gas demand increased MoM to 45.0mmscmd in Jul’25 (vs. 43.7mmscmd in Jun’25): Domestic gas consumption for CGD sector declined MoM (at 27.6mmscmd in Jul'25 vs. 28.0mmscmd in Jun'25); while LNG consumption increased MoM (at 17.5mmscmd in Jul'25 vs. 15.8mmscmd in Jun'25), above its historical LNG consumption range of 13-15mmscmd.
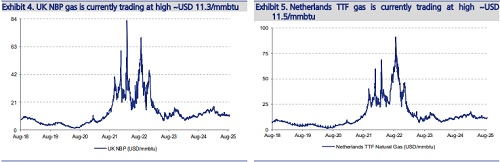
* Asian spot LNG price remained elevated ~USD 12/mmbtu or ~17% of Brent (vs. historical average of ~12% of Brent), trading at premium vs. alternative fuels; US Henry Hub (HH) gas price moderated to ~USD 2.6/mmbtu: Asian spot LNG prices continue to be elevated around USD 12/mmbtu or ~17% of Brent (vs. historical average of ~12% pre Russian-Ukraine crisis), led by Europe’s sustained restocking demand as gas inventory was depleted due to harsh winter, and on account of end of Russia gas supply to Europe via Ukraine by end-CY24 — Exhibit 1. Hence, spot LNG price is relatively higher vs. alternative fuel prices impacting its competitiveness — Exhibit 12. Further, European benchmark gas prices also remain high ~USD 11/mmbtu with EU gas storage inventories currently at 76%, below 91% YoY and 5-year average of 83% during the same period — Exhibit 4-6. Given the low inventory, EU has agreed to give more flexibility to the natural gas storage goals by proposing that the existing binding 90% filling target ahead of winter should be reached anytime between 1st Oct and 1 st Dec (vs. the current deadline of 1st Nov); it also agreed that, in case of unfavourable market conditions, member states may deviate by up to 10% from the filling target. Going forward, it will be critical to understand implementation of the European Commission’s plans to fully phase out EU's imports of all Russian gas and LNG by the end of 2027; this includes end-2025 ban on Russian gas spot deals and end-2027 halt to Russian gas import via long-term contract. This is critical amidst speculation that a revival of the Nord Stream pipelines (through which Russia supplies gas to Europe) could be a part of a deal for the end of the war in Ukraine. Separately, US Henry Hub (HH) gas price moderated to ~USD 2.6/bbl (from USD 3-3.5/bbl in Jul’25).
* Sustained high spot LNG price could continue to be a near-term concern for all gas companies: Sustained high spot LNG prices could continue to be a near-term concern for all gas companies, particularly for CGD companies like Gujarat Gas (given its 20-30% dependency on spot LNG) because spot LNG pricing competitiveness vs. propane has reduced as Saudi LPG/propane prices for Aug'25 were cut by USD 55/tn MoM to USD 520/tn while spot LNG price remained elevated around USD 12/mmbtu. Further, Argus estimates propane price to further moderate to ~USD 560/tn by Sep'25 and to USD 480/tn in CY26 — Exhibit 10-11. Moreover, elevated spot LNG prices can affect other CNG-dominated CGDs (like IGL and MGL) also especially due to continued reduction in allocation of low-cost APM gas for the CNG segment. Further, high spot LNG can impact domestic LNG demand across sectors and, hence, impact volume for Petronet LNG, GAIL and GSPL. However, US HH gas price has moderated to ~USD 2.6/bbl, (improving its competitiveness against spot LNG price and crude linked LNG) which could improve the trading margin of GAIL’s US HH linked LNG contracts— Exhibit 9. Spot LNG prices may remain elevated in the near term supported by Europe’s sustained restocking demand amidst halt of transit of Russian gas to Europe via Ukraine (since end CY24).
* However, spot LNG prices are likely to normalise in long term due to significant ~210mmtpa addition in global LNG supply capacity starting over next 2-3 years, led by US & Qatar: We expect likely normalisation in spot LNG prices to the historical average of ~12% of Brent in the medium to long term due to significant 40-50% addition in global LNG supply capacity in 5-6 years starting 2HCY26. As per World LNG report (2025) published by IGU, the global LNG liquefaction capacity growth was muted at 6.5mmtpa in CY24 to 494mmtpa. However, capacity utilisation was impacted slightly in CY24 due to maintenance, power disruption, and outages. Further, FID activity declined significantly in CY24 with only 14.8mmtpa of new liquefaction capacity reached FID stage while 1,122mmtpa of significant aspirational capacity was in pre-FID stage at end-CY24 led by US (367mmtpa), Canada (227mmtpa), Russia (170mmtpa), Africa (133mmtpa). Notably, ~210mmtpa of liquefaction capacity is under construction/approved of which 35/54/49/45mmtpa is likely to be added in CY25/CY26/CY27/CY28 led by US and Qatar – Exhibit 21.
Please refer disclaimer at https://www.jmfl.com/disclaimer
SEBI Registration Number is INM000010361