

Nifty & BankNifty Weekly Outlook 03-04-2026 by Choice Broking Ltd

NIFTY WEEKLY OUTLOOK
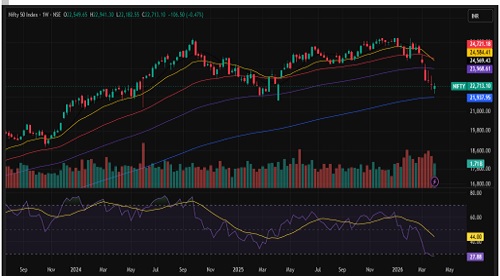
The Nifty 50 began the week on a weak note, opening around 270 points lower at 22,549. It touched a high of 22,941, indicating selling pressure at higher levels. As the week progressed, the index remained under sustained pressure and declined to a low of 22,182.55. However, in the latter part of the week, a recovery was witnessed, helping the index close at 22,713.10. Overall, it recorded a modest loss of 106.5 points, or 0.47%, reflecting a cautious to slightly negative market sentiment.
From a technical standpoint, the 22,150–21,900 zone is likely to act as a key support area. On the upside, resistance is seen in the 23,000–23,500 range. The Relative Strength Index (RSI) on the weekly timeframe stands at 27.88, indicating that the market is in an oversold territory and may be nearing a potential reversal zone.
Meanwhile, on the weekly chart, India VIX declined by 1.28 points (-4.79%) to close at 25.52, indicating a marginal moderation in volatility. However, the overall elevated VIX levels continue to reflect underlying caution, aligning with the broader sideways to bearish market trend. In the derivatives segment, significant call writing was observed at the 22,800 strike, with additional activity at 23,000. On the put side, strong writing was seen at the 22,500 strike, suggesting that these levels may act as immediate support. Given the elevated volatility, traders are advised to remain cautious and follow disciplined risk management strategies.
Support Levels :- 22,150–21,900
Resistance Levels :- 23,000–23,500
Overall Bias :- Sideways to Bearish
BANKNIFTY WEEKLY OUTLOOK
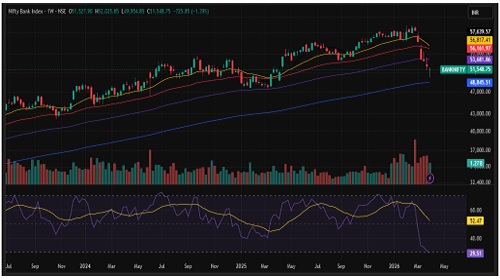
The Bank Nifty index began the week on a negative note, opening with a gap-down of 746 points at 51,527.25. It registered a weekly high of 52,025, where selling pressure emerged, dragging the index lower to a low of 49,954.85. However, some recovery was seen towards the end of the week, with the index closing at 51,548.
Overall, it recorded a decline of 725 points, or 1.39%, on a weekly basis, reflecting persistent bearish sentiment. On the weekly timeframe, the index has formed a Doji near the psychological level of 50,000, indicating indecision among market participants and suggesting a potential pause in the ongoing downtrend.
From a technical perspective, the index is likely to find support in the 50,000–49,500 range, while resistance is positioned around the 52,600–53,000 zone. The Relative Strength Index (RSI) stands at 29.51, reflecting that the index is approaching oversold territory and may see a potential pullback or consolidation.
However, failure to reclaim higher levels may keep the index under short-term corrective pressure. Traders are advised to remain cautious and follow disciplined risk management while closely tracking key levels for the next directional move.
Support: 50,000–49,500
Resistance: 52,600–53,000
Overall Bias :- Sideways to Bearish
For Detailed Report With Disclaimer Visit. https://choicebroking.in/disclaimer
SEBI Registration no.: INZ 000160131


.jpg)