


India Strategy : Corporate profit-to-GDP: Reaches unprecedented heights! by Motilal Oswal Financial Services Ltd

Earnings overcome headwinds:
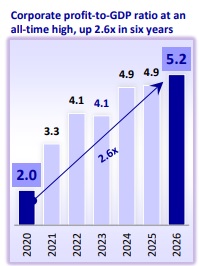
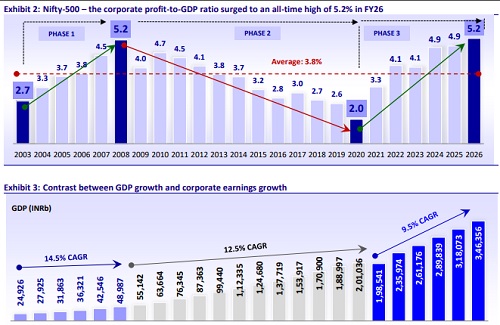
Corporate India’s earnings strength has come to the forefront despite markets being adversely affected by geopolitical challenges and their consequent impact on the Indian economy and corporate earnings. Notably, in 2026, the corporate profit-to-GDP ratio surged to an all-time high of 5.2% for the Nifty-500 Universe. Corporate profits rose at a faster rate of 15.6% YoY in FY26, following a slowdown to 11% YoY in FY25 (which had a high base of +32.6% YoY in FY24). We note that nominal GDP grew 8.9% YoY in FY26, slower than corporate profit growth, and 9.7% YoY GDP growth in FY25 (vs. 11% recorded in FY24). The sequential moderation in GDP was due to a sharp slowdown in manufacturing activity and softer external demand, partly offset by continued strength in services, improving agricultural growth, and accelerating investment spending.
Construing India's corporate profit-to-GDP ratio:
We take a closer look at the corporate profit-to-GDP ratio achieved by India’s listed corporate sector. Our analysis examines corporate earnings as a percentage of GDP in greater detail, using the Nifty-500 as a proxy for corporate earnings, as this index represents ~88% of India’s market capitalization.
India’s corporate profit-to-GDP ratio scales a historic peak in FY26
* In 2026, the corporate profit-to-GDP ratio for the Nifty-500 universe surged to 5.2%, marking an all-time high. Notably, for the listed India Inc., the ratio stood at 5.7%, at an 18-year high. The YoY increase in the profit-to-GDP ratio for the Nifty-500 was influenced by Automobiles (with a 0.19% increase in the ratio), Oil & Gas (+0.15%), Metals (+0.07%), NBFC Lending (+0.02%), Capital Goods (+0.02%), Insurance (+0.02%), et al. In contrast, sectors that experienced a decline in the ratio included Private Banks (a 0.04% decline), Consumer (-0.03%), Telecom (- 0.02%), Healthcare (-0.02%), and Infrastructure (-0.02%).
* The top-5 sectors contributed 76% to the aforementioned ratio, with BFSI (1.94% of the GDP), Oil & Gas (0.68%), Automobiles (0.52%), Metals (0.42%), and Technology (0.40%) being the key contributors. In contrast, e-commerce was the only sector that contributed adversely to the corporate profit-to-GDP ratio.
* The corporate profit for the Nifty-500 universe grew at a faster pace of 15.6% YoY in FY26, after slowing down to 11% YoY in FY25 (high base of +32.6% YoY in FY24). We note that the nominal GDP grew 8.9% YoY, slower than the corporate profit growth in FY26 and 9.7% YoY GDP growth in FY25 (vs. 11% recorded in FY24).
* Profits for Nifty-500, which have remained stagnant at INR4-6t over FY14-21, saw a big leap to INR9.8t in 2022 and further to INR18.1t in 2026 (~up 2x in the last four years). Notably, during 2020–26, the corporate profit CAGR of 28.7% was much higher than the GDP CAGR of 9.5%.
Large- and mid-caps add to the ratio as small-caps’ weight moderates
* According to SEBI's categorization, large-, mid-, and small-cap stocks accounted for 3.94%, 0.87%, and 0.42% of the total Nifty-500’s corporate profit-to-GDP ratio, respectively.
* The Nifty-500 ratio was driven higher by large- and mid-caps, while small-caps moderated. The large- and mid-cap ratios grew to 3.94% and 0.87% in FY26 from 3.71% and 0.76% in FY25, respectively. Small-caps witnessed a slowdown to 0.42%, down marginally from 0.45% recorded in FY25.
* Large-cap stocks have posted substantial gains since the 2020 lows, more than doubling in value (rising 2.3x), in contrast to their earlier trend of sustained weakness from the highs of 2008 through 2020.
* The mid- and small-cap shares have also experienced a healthy increase in the corporate profit-to-GDP ratio since the lows of 2020, rising 32.8x and 1.6x, respectively. This marks a reversal from the period between 2008 and 2020, during which mid-caps faced a significant decline, while small-caps exhibited range-bound performance.
Private and PSU companies bolster the ratio
* We analyze India’s corporate profit-to-GDP distribution across three categories of ownership, i.e.,
1) Private Corporate,
2) PSU Corporate
3) MNCs.
* On an ownership basis, the corporate profit-to-GDP ratio for Private companies within the Nifty-500 reached an all-time high of 3.2% in FY26, up from 3.0% in FY25. The ratio for PSUs also increased to 1.8% in FY26 from 1.7% in FY25. For MNCs, notably, the ratio stood at a new high of 0.24% in FY26 (0.23% in FY25).
* PSUs recorded the sharpest increase in the corporate profit-to-GDP ratio since the lows of 2020, fueled by a broad-based earnings recovery, particularly among PSUs Banks, Insurance, and Oil & Gas sectors. The ratio surged more than threefold to reach 1.8% in 2026 from 0.5% in 2020. In comparison, Private and MNC companies within the Nifty-500 universe also recorded notable gains, with their ratios surging 2.5x to 3.2% and 1.4x to 0.24% in 2026 (from 1.3% and 0.18% in 2020), respectively.
For More Research Reports : Click Here
For More Motilal Oswal Securities Ltd Disclaimer
http://www.motilaloswal.com/MOSLdisclaimer/disclaimer.html
SEBI Registration number is INH000000412


More News
Nifty immediate support is at 24442 then 24350 zones while resistance at 24750 then 24900 zo...