The index started the week on a subdued note - ICICI Direct Ltd

Nifty : 24270
Technical Outlook
Week that was ..
• Equity benchmark compounded its gains over fourth consecutive week and settled the monthly expiry week at 24271, up 0.9%. Small cap index significantly outpaced with a robust 2% advance. Sectorally, Realty, Pharma, Defence remained at forefront while PSU Bank, energy underperformed.
Technical Outlook :
• The index started the week on a subdued note. However, buying demand from 50 days EMA (23800) helped index to regain the momentum. However, buying demand from 50 days EMA (23800) helped index to regain the momentum. The weekly price action formed a bull candle carrying higher high-low, indicating continuation of upward momentum
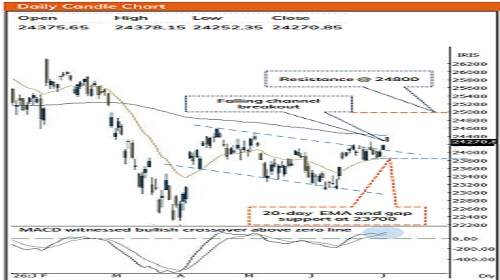
• The index has decisively registered a breakout from ten weeks downward sloping channel coupled with successful close above 100 days EMA for the first time in four months, indicates resumption of primary uptrend that can drive Nifty towards 24800 in the month of July
• The underlying stature remains robust as over past two weeks index has formed a higher base above cluster of short-term moving averages. The formation of higher peak and trough confirms structural improvement that makes us revise support base at 23700
• Midcap index continued to hover around lifetime highs while smallcap index has seen significant catch-up activity as it is just 3% away from its All Time High. The current traction in broader market is backed by improvement in market breadth as currently 62% of stocks within Nifty 500 universe are trading above their 50 days SMA compared to last week’s reading of 58%, that bodes well for durability of ongoing up move
• Sectorally, Pharma index broken out of 18 months consolidation and clocked a fresh All-time High. The up move since Covid lows has been captured in a well-defined rising channel wherein intermediate corrections arrested around 20%. Post this pharma index has garnered decent returns in subsequent quarters. Mirroring the historical evidence, index has bounced after 20% correction The buoyancy in the equity market is well supported by convergence of favourable macroeconomic tailwinds :
• Easing of geopolitical tension
• Falling crude oil prices
• Rupee appreciation
• RBI’s slew of measures to attract foreign flows into debt instruments
• Q4FY26 GDP growth •Lower expectations of Fed’s rate hikes
Key Monitorable :
• Fed Minutes
• Commencement of Q1 earnings
Intraday Rational :
• Trend – Breakout from 10 weeks falling channel confirms resumption of uptrend
• Levels – Buy around 80% retracement of 2 days range
Nifty Bank : 57938
Technical Outlook
Week that was :
Bank Nifty Index ended the week negative down 0.35% at 57938 levels. Nifty PSU Bank relatively underperformed losing 2.5%.
Te chnical Outlook :
• Index oscillated in a narrow range throughout the week. Consequently, the weekly price action resulted into inside bar, indicating elevated volatility amid positive bias.
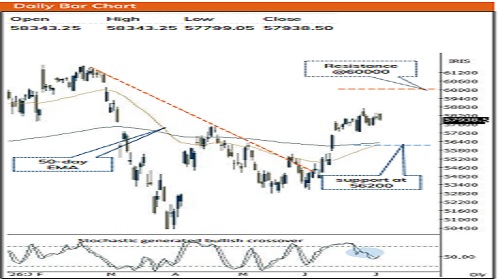
• Going ahead we expect index to continue its upward momentum and challenge the recent swing high of 58700, that would pave the way towards 60000 in coming weeks
• The ratio chart of Bank Nifty vs Nifty has witnessed breakout from a 5-years consolidation. This technical setup signals that the banking index is poised to accelerate its relatively outperformance and head towards 60000 in the coming month as it is gap-area formed on 2nd March 2026
• The elevated buying demand highlights strength, thereby any decline should be capitalized as incremental buying opportunity as strong support is placed at 56200 being 200-day EMA coinciding with 61.8% retracement of current up move(55726- 58021)
• PSU Bank Index has formed lower high lower low after 4 weeks up move, indicating extended profit booking. Immediate support is placed around 8250 being 200 days EMA. Going forward we expect Index to consolidate in range 8500-8200 in coming sessions and set the stage for next leg of up move
Intraday Rational :
• Trend - Higher base formation above 10 days EMA signifies positive bias
• Levels : Buy around 80% retracement of 3 days range
Please refer disclaimer at https://secure.icicidirect.com/Content/StaticData/Disclaimer.html
SEBI Registration number INZ000183631