
Diwali Stock Picks 2026 by Bajaj Broking Research

Mahindra & Mahindra Ltd
Mcap – Rs 3,614.94 bn Entry: 2,860 –2,890 Target: 3,251
About the Company
Mahindra & Mahindra is India's largest SUV maker by revenue share (25.3% in FY 26) and the country's biggest tractor company (43 .6% share) . It also leads small pick - ups (52.3%) and electric three - wheelers (40 .0%), and holds stakes in Tech Mahindra, Mahindra Finance, the EV arm MEAL and a string of listed and unlisted businesses, so the stock trades partly as an OEM and partly as a holding company .
Earnings Growth from a Mid - Cycle Base – Consolidated EPS is estimated to rise from Rs.153.1 in FY 26A to Rs.237.3 in FY 29E, with PAT growing about 16% a year . FY 26 was a strong tractor year while Auto margins sat below normal on commodities, so FY 27E standalone EBITDA is only 1.6% above the mid- cycle estimate – the forecasts do not lean on a peak year .
Pricing Power Protects Profitability – Standalone EBITDA is expected to rise from Rs.209 .8 bn in FY 26A to Rs.282 .9 bn in FY 29E. Price increases contribute Rs.69 .8 bn of that, more than volume from existing models (Rs.32.6 bn) or new launches (Rs.23.3 bn), offsetting Rs.77.2 bn of commodity pressure and holding margins near 13.3%.
Capacity for the Next SUV Leg – SUV plants ran at about 91% utilisation in FY 26. ICE capacity rises from 56 ,500 to 80 ,000 units a month by FY 28 , the first NU_IQ models arrive in FY 28 and the Nagpur plant follows in H1 CY 2029 , supporting domestic UV volumes rising from 0.66 mn to 0.95 mn units by FY 29E.
EV Leadership Without the Cash Drain – EVs are 12% of M&M's SUV sales against 9% for the industry, and eSUV volumes rose 77% YoY . MEAL made a PBIT of Rs.2.42 bn in FY 26 and is EBITDA - positive even without PLI, so the parent needs to put in only Rs.12.0 bn, Rs.10.0 bn and Rs.8.0 bn over FY 27E–FY 29E.
Cash - Rich, with Embedded Group Value – Standalone net cash rises from Rs.319.1 bn to Rs.635 .9 bn by FY 29E with the capex plan funded internally . Listed stakes in Tech Mahindra, Mahindra Finance, SML Mahindra, Lifespaces and others are worth about Rs.836 .6 bn at market prices, and ROCE improves from 41.5% to 48 .9%.
Key Risks – A rally in steel, rubber or aluminium that pricing cannot recover, supplier and weather disruptions, clarity on PLI beyond FY 28 and execution on the upcoming launches .
Valuation – Target price of Rs.3,251. We value M&M on a sum - of- the - parts on FY 28 E: core Auto and Farm on one - year - forward EV/EBITDA, MEAL at its last funding round less 20 %, listed stakes at market less a 25% holding - company discount, plus net cash .
Varun Beverages Ltd
About the
Company Varun Beverages is the largest bottler PepsiCo has outside the United States, selling in 27 countries and reporting on a calendar year . It makes and delivers the drinks – colas, Sting, juice drinks, dairy and water – while PepsiCo owns the brands and sells VBL the concentrate . India is about two- thirds of volume ; the rest comes from Morocco, Zimbabwe, Zambia, the DRC, Nepal, Sri Lanka, South Africa and, from this year, Kenya .Mcap – Rs.1,325.94 bn Entry: 394 –402 Target: 459 Upside: 15%
Volume - Led Earnings Compounding – Sales rose from 569 mn cases in CY 21 to 1,220 mn in CY 25 and are expected to reach 1,941 mn by CY 28 E, or 16.7% a year . Growth has come from volume rather than price – realisation per case moved only from Rs.155 to Rs.180 in five years – taking EBITDA from Rs.50 .3 bn in CY 25 to Rs.91.9 bn and EPS from Rs.8.8 to Rs.16.1 by CY 28 E.
Operating Leverage on Installed Capacity – In most of Africa, output in the busiest quarter is already at its limit, and new lines are going into Morocco, Zimbabwe and the DRC . Once the build finishes, coolers and outlets already in place carry the extra cases at almost no added cost, lifting EBITDA margin from 22.5% in CY 26 E to 24 .1% in CY 28 E.
International Growth Engine – International volume reaches 506 mn cases in CY 26 E, up 32.8%, having grown more than 20 % in every quarter this year before acquisitions . Twizza merged into BevCo on 1 August 2026 ; because Twizza makes its own packaging, international gross margin has held up better than India's . In Zimbabwe, the market grew from 35 mn cases at VBL's entry to close to 75 mn .
Cost Levers Absorbing Inflation – In Q3, revenue rose 33 .2% to Rs.66 ,076 mn and EBITDA 25.1% to Rs.14,267 mn, with margin down only 140 bp to 21.6% despite a ~300 bp packaging hit. More than half of the cost increase has already been recovered through savings, and low/no -sugar drinks rising to 88 % of the India mix from 44 % largely offset a 16% rise in sugar costs .
Self - Funding Growth – Net debt excluding leases of Rs.256 mn at CY 25 turns into net cash of Rs.52.9 bn by CY 28 E as cash from trading rises from Rs.43 .8 bn to Rs.70.7 bn. ROCE improves from 18.2% to 22.0% and ROE from 16.6% to 18.7%, as volume fills factories that have already been paid for.
Key Risks – Input costs with no guidance on materials, cheap entrants and local brands (worst in water), Overseas inflation, and execution on new lines and acquisitions .
Valuation – Target price of Rs.459 . We value each business separately on CY 27E profits (sum of the parts), discounted back at an 11.55% cost of equity and arrive at a target price of Rs .459 .
CG Power & Industrial Solutions Ltd
Mcap – Rs.1,286.06 bn Entry: 800 –820 Target: 938 Upside: 16%
About the Company
CG Power & Industrial Solutions is a global enterprise providing end - to- end solutions to utilities, industries and consumers for the management and application of efficient and sustainable electrical energy . It offers products, services and solutions across two main segments – Power Systems and Industrial Systems – and maintains a healthy order backlog of Rs.218.20 bn.
5 %+ Growth with Expanding Margins – Revenue is estimated to grow 25.6% in FY 27E and 26 .7% in FY 28 E to Rs.197.5 bn, with EBITDA rising from Rs.16.3 bn to Rs.27.8 bn as margin expands from 13.1% to 14.1%. EPS rises from Rs.7.7 in FY 26 to Rs.13.4 in FY 28 E.
Transformer Capacity Step - Up – The newly commissioned greenfield transformer facility in Madhya Pradesh, claimed to be India's largest at a single location, was completed within 13 months and spans over 50 acres . It will make 220 kV to 1200 kV transformers, around 35 a month at peak utilisation , while capacity enhancement at Bhopal continues . The Power segment backlog of ?189.64 bn provides a strong execution pipeline .
Motors Margin Turnaround – The motors business has crossed the double - digit margin threshold, driven by CG Edge productivity initiatives, portfolio optimisation and waste reduction, while price increases of over 30 % in the last twelve months largely offset commodity inflation . A next - generation motor platform is rolling out over 9–12 months, and permanent magnet and IE5+ motors should strengthen export competitiveness . The Industrial backlog stands at Rs.28 .56 bn
Sharply Improving Returns – ROE is estimated to rise from 15.0% in FY 26 to 26 .1% in FY 28 E and ROCE from 20 .7% to 33 .9%, with debt - to- equity at 0.1x. Management points to structural tailwinds from T&D capex, railway modernisation and Make in India .
Semiconductor Optionality – CG Power has invested around Rs.10 bn in its semiconductor project, with an equivalent amount received as government capital support . Subsidiary Axiro Semiconductor acquired TOSIL Systems in Q2FY 27; qualification is expected to begin next year, with commercial production targeted for FY 29.
Key Risks – The cyclical nature of the power business, increasing transformer supply in India, no prior experience in semiconductors, and railway revenues that may stay flat or decline near term as the company prioritises profitability .
Valuation – We value the company using the P/E method, applying a 70x multiple to FY 28 E earnings, arriving at a target price of Rs.938 .
GE Vernova T&D India Ltd
Mcap – Rs.1,058.0 bn Entry: 4,080 –4,165 Target: 4,545 Upside: 10%
About the Company
GE Vernova T&D India is the listed Indian arm of GE Vernova's power grid business, 51.0% parent - held . It sells equipment outright – transformers to 1200 kV, switchgear to 800 kV, instrument transformers, breakers, bushings and reactors (Rs.18.6 bn in FY 26 ) – and executes projects and services (Rs.42 .9 bn) recognised as work proceeds, so revenue is drawn from the order book . Above both sit complete HVDC systems, FACTS, STATCOM and grid automation . Exports were 32.7% of FY 26 sales .
Order Book Underwrites Growth – The order book stood at Rs.214.4 bn on 30 September, more than three years of FY 26 revenue, and does not yet include the 6,000 MWBarmer II–South Kalamb HVDC project, where the company is lowest bidder (estimated Rs.65 .0 bn). Revenue is estimated to rise from Rs.62 .1 bn in FY 26 to Rs.93 .9 bn in FY 28 E, with EPS rising from Rs.48 .17 to Rs.72.78.
Margins at the Top of Guidance – Gross margin recovered to 44 .5% in Q2 from 41.3% in Q1, and the first- half EBITDA margin of 26 .2% sits at the top of the mid- 20 s guidance reaffirmed on 30 October 2026 . First - half revenue of Rs.38 .6 bn rose 35% with profit of Rs.7.9 bn, while Q2 order intake rose 52% to Rs.24 .4 bn with no single large contract behind it.
Multi - Year HVDC and Transmission Pipeline – At least two to three more HVDC projects are expected to be tendered next year, with a meaningful volume of STATCOM orders in Q4 and a strong pipeline of competitively bid transmission projects . Demand is driven by long - distance renewable transmission, grid digitalisation and integration of flexible capacity and storage
Localisation and Export Recovery – HVDC transformers, valves and control systems are now made in India, with 68 % local content overall . Exports recovered to 29% of H1FY 27 order intake from 8% in FY 26 , with H1 export orders of about Rs.10.4 bn against Rs.11.8 bn for all FY 26 . A Rs.10.0 bn capacity expansion is under way, with about 20 % spent
Customer - Funded Cash Generation – Advances scale with order intake, so customers fund working capital : FY 27E operating cash flow of Rs.11.8 bn and free cash flow of Rs.7.6 bn rising to Rs.11.2 bn take net cash to Rs.41.4 bn by FY 28 E, with ROE of 49 .6% in FY 27E.
Key Risks – Conversion of the Barmer II lowest - bidder position, Rs.34 –44 bn of base orders needed in H2FY 27, FY 28 margins easing towards a 24 .2% sustainable level as low- priced contracts roll off and HVDC mix rises, and supply - chain lead times .
Valuation – Target price of Rs.4,545 . We value the stock on a P/E applied to FY 28 E EPS of Rs.72.78..
Sudarshan Chemical Industries Ltd
Mcap – Rs.82.13 bn Entry: 1,010 –1,035 Target: 1,144 Upside: 12%
About the Company
Sudarshan is India's largest pigment manufacturer and, after the Heubach acquisition, a top- tier global colorants platform with ~253 ,000 MT of capacity across 19 sites in 11countries . It is best assessed as two earnings streams : legacy Sudarshan Pigments (India, ~78,000 MT), which is structurally profitable, and acquired Group Pigments (ex - India, ~175,000 MT), a turnaround asset earning well below its capability .
Utilisation - Led Earnings Recovery – India earned a 14.8% margin and the overseas platform 2.6% on 71% of revenue – a gap explained by utilisation, not pricing . Overseas utilisation is modelled at 68 .0% → 71.5% → 74.5% and legacy at 79.6% → 86 .0% → 92.0%; at a ~42% incremental margin, each point of overseas utilisation adds about Rs.450 mn of EBITDA with no growth capex . EBITDA rises from Rs.5.9 bn in FY 26A to Rs.11.6 bn in FY 28E.
Acquired Business Has Turned – Acquired - group business EBITDA more than doubled YoY to Rs.1.28 bn in Q1 from Rs.0.65 bn, against close to zero at acquisition . FY 27 guidance of EUR 700 mn revenue and EUR 35 mn EBITDA was retained despite a stronger Q1, with a review at the end of Q2 – a potential upgrade trigger .
Synergies Drive the EBITDA Bridge – Management sees EBITDA rising from ~Rs. 8 bn to Rs.14–15 bn, driven substantially by cost reduction and value capture, with the major portion landing in FY 27–FY 28 . Levers span footprint optimisation, procurement, IT (One SAP "Project Integra"), SG&A and SKU pruning, alongside FY 29 targets of ~16–17% revenue CAGR .
Sticky, Cost - Advantaged Franchise – Pigment approvals take 1–2 years in coatings and up to five years in automotive, so switching costs are high . With 55–60 % of assets in Asia, 1,600 + products and 4,000 + customers, the company holds a cost advantage over global peers ; Q1 gross margin was ~54 %, with 50 %+ guided as sustainable .
Deleveraging Turns to Net Cash, with EPS Recovery – Net debt fell to Rs 5.31 bn from a peak of Rs 9.22 bn in under 18 months, and the balance sheet now crosses over: the Rs 7.29 bn of net proceeds from the VP 4 Frankfurt disposal takes the group to a net cash position of Rs 2.43 bn in FY 27E and Rs 7.08 bn by FY 28 E, as incremental EBITDA and disposal proceeds go to debt reduction rather than capex . Net debt/equity turns negative from FY 27E. EPS rises from Rs 2.8 in FY 26A to Rs 62.7 in FY 28 E, with ROE improving from 0.7% to 10.1%..
Key Risks – An unquantified employee restructuring charge at a subsidiary, Middle East - driven energy and freight costs, price give - back if raw materials soften, subdued US/Europe coatings demand, the One SAP transition and RIECO's recovery .
Valuation – Target price of Rs.1,144. We value Sudarshan on a sum - of- the - parts (SOTP) basis, supported by long - term operating leverage from the utilisation ramp - up across already - installed capacity .
Rolex Rings Ltd
Mcap – Rs.43.28 bn Entry: 163 –167 Target: 185 Upside: 12%
About the Company
Rolex Rings is one of India's five largest forging companies and a global supplier of hot- rolled forged and machined bearing rings (47% of revenue) and automotive components (45 %). Established in Rajkot, Gujarat, it began forging in 1988 and operates as a merchant forger with deep downstream integration : 90 % of output ships as machined components and 44 % of revenue comes from exports . Its moat rests on process expertise, precision manufacturing, consistent quality and reliable execution, supporting long -standing relationships with leading OEMs
Earnings Rebound from a Depressed Base – Revenue is estimated to grow 15.0% in FY 27E and 17.4% in FY 28 E, conservatively below management's guidance of mid - teens growth in FY 27 and nearly 20 % in FY 28 . With EBITDA margin widening from 20 .1% to 22.2% and FY 26 profit carrying a one - off exceptional charge, PAT is estimated to rise from Rs.1,413 mn in FY 26 to Rs.2,710 mn in FY 28 E.
Demand, Not Market Share, Held Growth Back – FY 22–FY 26 growth was flat on US tariffs, a temporary shutdown at a key US customer and weak European demand . Through this period the company retained all its customers, won new programmes and sustained EBITDA margins above 20 %. With spare capacity in place, a demand recovery should flow through as operating leverage . EV/hybrid revenue was 7.7% of FY 26 but remains volatile, while defence and non - bearing railway initiatives offer medium - term optionality .
China+ 1 and Outsourcing Tailwinds – The rebound is reinforced by normalising US exports, China+ 1 opportunities as European OEMs diversify forging supply chains, and rising OEM outsourcing of domestic bearing rings .
Entrenched OEM Franchise – Rolex supplies bearing races to SKF, Schaeffler, Timken, NEI/NBC and NRB (the top five hold 80 % of the market) and critical transmission and drivetrain components to Allison Transmission and Magna/Getrag across the US, Mexico and Europe . Seven of its top ten customers have partnered with the company for over 15 years .
Debt - Free Balance Sheet and Buyback – The company exited CDR in 2022 and settled its residual RoR liability of Rs.1,010 mn on 31 March 2026 entirely from internal cash, leaving it debt - free with Rs.3,670 mn of cash and investments . A Rs.1,800 mn buyback of 10 mn shares at Rs.180 cuts the share count from 272.3 mn to 262 .3 mn, underpinning EPS growth to Rs.10.3 by FY 28 E, while ROE improves from 16.9% to 19.3%.
Valuation – Rolex Rings is well placed to benefit from a recovery in export demand, improving capacity utilisation and operating leverage . We value the company at 18x FY 28 E earnings, arriving at a target price of Rs.185.
ICICI Bank Ltd
Mcap – Rs 10,016.18 bn Entry: 1380 –1410 Target: 1570 Upside: 12%
Technical Outlook
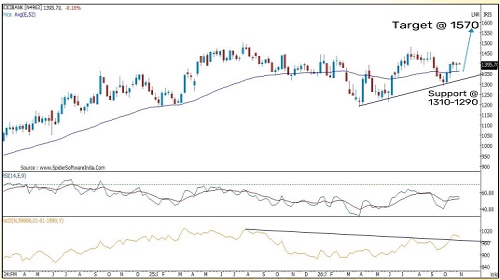
The share price of ICICI Bank is in strong positive trend and is outperforming the Bank Nifty . On the ICICI Bank/Bank Nifty ratio chart it has generated a breakout above falling supply line joining last 15 months highs signaling strength and extension of the recent outperformance .
On the weekly chart the stock is sustaining above its 52 weeks EMA and the rising demand line joining the current year low highlighting strength .
We expect the stock to extend the outperformance and head towards 1570 in the long term being the 123.6% external retracement of the previous major decline from 1500 - 1188.
The weekly 14 periods RSI is in uptrend and is sustaining above its nine periods average thus validates positive bias in the stock .
Adani Power Ltd
Mcap – Rs 3744.32 bn Entry: 188 –194 Target: 223 | Upside: 16%
Technical Outlook
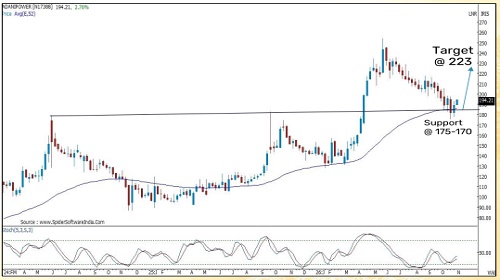
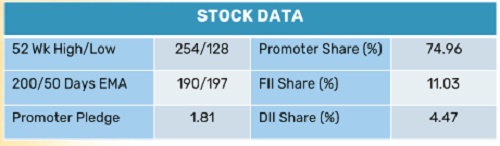
The last 5 months corrective decline in the share price of Adani Power has approached maturity as the stock is seen rebounding taking support at the major support area of 175 being the confluence of the 52 weeks EMA and the neckline of the previous major cup & handle breakout area of April 2026 .
The stock has rebounded from the support area and has started forming higher high in the weekly chart signaling positive momentum returning in the stock .
We expect the stock to resume its primary up trend and head towards 223 levels in the coming quarters being the 61.8% retracement of the previous decline 254 - 175.
The weekly stochastic has also generated buy signal highlighting strength .
Lloyds Engineering Works Ltd
Mcap – Rs 130.71 bn Entry: 82 –84 Target: 99 Upside: 19%
Technical Outlook
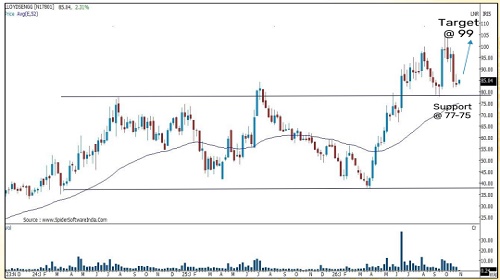
The stock is an outperformer in the current year and is forming higher high and higher low in the long - term chart . In the current year it has generated a breakout above the 2- year consolidation range of 77- 35 and has rallied higher in the current year .
The stock has strong support at 77- 75 levels being the upper band of the recent range breakout and 52 weeks EMA.
We expect the stock to extend its outperformance and head towards 99 - 104 levels in the coming quarters being the recent all time high .
On the volume front the stock has seen price rise with strong volume while at price decline the volume is relatively low, highlighting larger participation at the direction of trend .
Above views are of the author and not of the website kindly read disclaimer