Credit Cost Rises in Q1FY26; Asset Quality Worsens Marginally Sequentially by CareEdge Ratings
Synopsis
* Gross Non-Performing Asset (GNPA) ratio of Scheduled Commercial Banks (SCBs) improved to 2.3% as of Q1FY26, from 2.7% over a year ago. GNPA reduced by 9.5% year-on-year (y-o-y) to Rs 4.18 lakh crore as of Q1FY26.
* Net Non-Performing Asset (NNPA) ratio of SCBs remained at 0.5% in Q1FY26 for the second consecutive quarter against 0.6% over a year ago. NNPAs reduced by 8.7% y-o-y to Rs 0.92 lakh crore as of Q1FY26.
* Sequentially, the quantum of GNPAs of SCBs rose by 0.5% q-o-q, driven mainly by higher incremental slippages and stress observed in the microfinance and unsecured segments at select banks. Similarly, NNPAs increased by 2.5% q-o-q.
* SCBs' aggregate credit cost increased by 62.7% y-o-y in Q1FY26; the credit cost (annualised) ratio increased to 0.61% in Q1FY26 compared to 0.41% in Q1FY25.
* Private sector banks (PVBs) witnessed an increase of 172.1% y-o-y, as one major PVB that created contingency and floating provisions, utilising the stake sale gains in its subsidiary and other treasury gains, while public sector banks (PSBs) saw a decline in credit costs by 4.8% y-o-y in Q1FY26.
* Restructured assets (seven PSBs + nine PVBs) as a percentage of net advances stood at 0.61% as of Q1FY26, reducing by approximately 31 bps over the previous quarter.
Figure 1: SCBs – Gross NPAs and Net NPAs Ratio Trend (%)
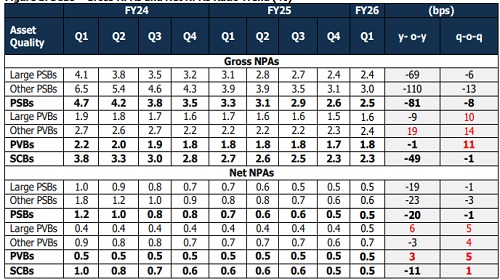
The overall stress level of SCBs has reduced on a y-o-y basis with a combined decrease in GNPAs and the restructured book in Q1FY26. The GNPAs of SCBs improved by 9.5% y-o-y to Rs 4.18 lakh crore as of Q1FY26, due to steady recoveries, upgradations and write-offs in PSBs. In contrast, GNPAs of PVBs rose by 7.6% y-o-y, driven by an increase in slippages and stress in the microfinance portfolio of certain PVBs.
* GNPAs of PSBs declined by 15.6% y-o-y to Rs 2.87 lakh crore in Q1FY26, reflecting sustained strengthening in asset quality. As the legacy pool has reduced, incremental recoveries in Q1FY26 were lower, with total write-offs and recoveries falling 14% y-o-y to Rs 0.29 lakh crore. However, fresh slippages rose 14.4% y-oy to Rs 0.29 lakh crore.
* GNPAs of PVBs rose by 7.6% y-o-y to Rs 1.31 lakh crore as of Q1FY26. PVBs experienced an increase in slippages, reaching Rs 0.36 lakh crore in Q1FY26, up from Rs 0.26 lakh crore in Q1FY25. This was driven by technical impact from one large PVB, coupled with stress in MFI and unsecured retail portfolios at select banks. Additionally, the elevated slippages reported by a large PVB in the previous quarter have not yet fully normalised, further adding to the uptick. The NNPAs of SCBs reduced by 8.7% y-o-y to Rs 0.92 lakh crores as of Q1FY26, compared to Rs 1.01 lakh crore a year ago. NNPAs of PSBs improved by 20.0% y-o-y to Rs 0.55 lakh crore as of Q1FY26, while NNPAs of PVBs increased by 15.7% y-o-y to Rs 0.37 lakh crore, driven by stress seen in microfinance and unsecured segments. Sequentially, GNPAs of SCBs rose marginally by 0.5% in Q1FY26. This increase was driven entirely by PVBs, whose GNPAs grew 7.3% q-o-q, partly due to sector-specific stress in microfinance and select unsecured segments, along with some technical slippages leading to a marginal worsening of asset quality. In contrast, PSBs saw a 2.3% q-oq decline in GNPAs, reflecting continued asset quality improvement supported by steady recoveries and lower incremental slippages. Write-offs across SCBs fell significantly by 19.3% q-o-q.
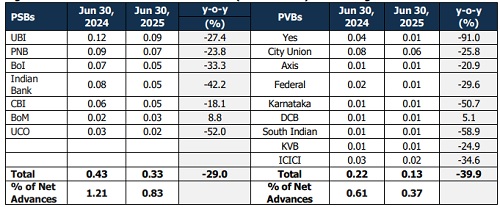
Figure 2: Sector-wise GNPA of PSBs as a % of Total Advances
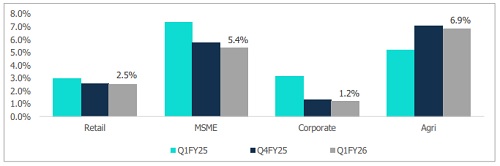
By Q1Y26, the sectoral GNPA as a percentage of total advances for PSBs showed a declining trend across all segments except agri. This improvement could be attributed to overall improved asset quality, upgradation efforts and stringent norms on retail lending.
Retail NPAs could largely be attributed to stress on unsecured loans, education, and credit card receivables. India’s banking system has increasingly favoured retail loans, driven by enhanced access to personal loans and reduced corporate borrowing due to deleveraging and alternative financing options. In contrast, Agri NPAs remain elevated
due to election-linked loan waivers that weaken repayment discipline, high dependence on monsoons and weather shocks, volatility in crop prices and MSP policies, and structural issues and politically sensitive recoveries further weigh on asset quality.
Figure 3: SCBs NNPA Ratio Holds at Historic Low for the Second Consecutive Quarter in Q1FY26 (%)
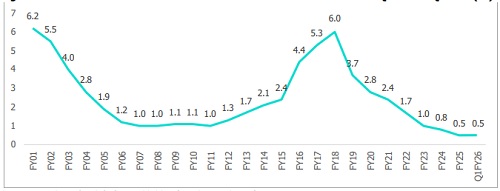
As of March 31, 2018, the NNPA ratio stood at 6%, falling significantly to 0.5% as of Q1FY26, the lowest in the post-AQR period and stable for the past two quarters. This structural improvement was driven by a combination of factors: large-scale write-offs, sustained recoveries from legacy NPAs, higher provision coverage, and earlier resolutions under the IBC 2016 framework. While asset quality remains strong, the pace of fresh recoveries has moderated in recent quarters as the pool of older stressed assets has diminished.
Figure 4: PSBs: Recoveries, Upgrades, Write-Offs and Fresh Slippages (Rs. Lakh - Cr.)
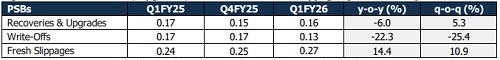
Figure 5: PVBs: Recoveries, Upgrades, Write-Offs and Fresh Slippages (Rs Lakh - Cr.)
PSBs' slippage ratio has remained lower than that of PVBs, supported by a mix of structural and cyclical factors. Lending growth has been skewed towards low-risk retail segments, particularly mortgages, while expansion in unsecured retail loans has been measured, and large corporate defaults have been minimal. In addition, the cleanup of legacy stress has progressed, with many overdue accounts from the past two to three years either resolved or provided for, thereby reducing the pool of high-risk exposures.
Additionally, in Q1FY26, PSBs recorded a 15.3% y-o-y rise in recoveries from technical written-off accounts, amounting to Rs 5,644 crore.
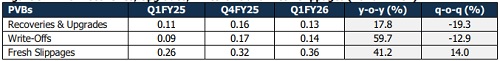
Figure 6: Restructured Portfolio of Select SCBs (Rs. Lakh - Cr.) – Shows Significant Reduction
Overall, the outstanding restructured loan portfolio has declined as pandemic-related restructuring schemes have wound down, borrowers have repaid, and new stress formation has moderated. For seven select PSBs, the restructured portfolio fell by 29.0% y-o-y to Rs 0.33 lakh crore as of Q1FY26, while for nine select PVBs, it dropped by 39.9% y-o-y to Rs 0.13 lakh crore. The reduction reflects a mix of healthy repayments and ageing out of past restructured accounts.
Consolidated Security Receipts of ARCs – Shows Slower Recovery in SR Reductions
Figure 7: SRs Portfolio (Cr.)
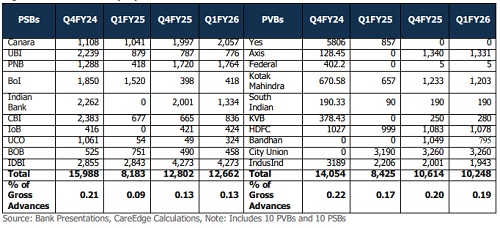
PSBs and PVBs witnessed an increase in outstanding SRs, with PSBs increasing by 55% and PVBs growing by 22% y-o-y, with levels remaining elevated in Q1FY26 despite some moderation from Q4FY25. PSBs o/s SRs increased to Rs 12,662 crore in Q1FY26, while PVBs, after reaching Rs 10,614 crore in Q4FY25, eased marginally to Rs 10,248 crore in Q1FY26. This reflects slower SR reductions during Q1FY26 compared with the strong recovery momentum for Q1FY25. The moderation in recoveries was partly due to delays in the resolution of certain large accounts and fresh SR issuances.
Provision Coverage Ratio (PCR)
Figure 8: SCBs PCR Trend (%)
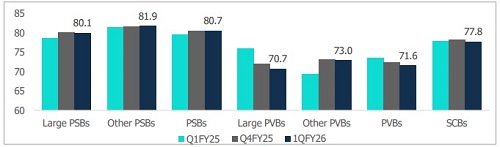
* The PCR of SCBs decreased marginally by 0.3% y-o-y and stood at 77.8% in Q1FY26, mainly driven by large PVBs with a PCR of 71.6% o PSBs PCR improved by 105 bps y-o-y to 80.7% in the quarter, as the reduction rate in GNPAs was faster than accumulated provisions.
* PVBs PCR declined by 200 bps y-o-y to 71.6% in the quarter, primarily due to lower provisioning on standard assets resulting from shifts in the product mix portfolio, driven by large PVBs.
Figure 9: Credit Costs (Profit & Loss) (Rs. Lakh – Cr.)
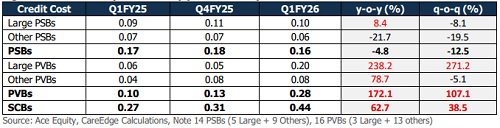
The credit cost for SCBs increased by 62.7% y-o-y to Rs 0.44 lakh crore in Q1FY26. In contrast, PSBs saw a decrease in credit cost of 4.8% y-o-y to Rs 0.16 lakh crore in Q1FY26, with large PSBs indicating a significant increase in provisions for the quarter. Meanwhile, credit costs for PVBs increased significantly by 172.1% y-o-y in the quarter, largely due to one major PVB that created contingency and floating provisions of Rs 0.11 lakh crore, utilising the stake sale gains in its subsidiary and other treasury gains. Excluding this impact, PVBs' credit costs would amount to Rs 0.17 lakh crore, marking a 64.3% y-o-y increase.
Figure 10: Credit Costs (In %, Annualised)
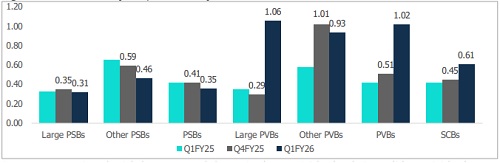
Credit cost (annualised) of SCBs increased by 19 bps y-o-y to 0.61% in Q1FY26. However, for PSBs, it decreased by six bps y-o-y to 0.35% in Q1FY26, while for PVBs, it increased to 1.02% during the same period.
Sequentially, NNPAs for PSBs decline marginally by six bps, while for PVBs they rose by 51 bps. The uptick among PVBs was primarily driven by higher provisions at a large private bank, mainly on account of technical accounting adjustments, alongside increased slippages reported by a few other PVBs during the quarter. Excluding this oneoff impact from a large private bank, credit costs for PVBs would have remained broadly stable at 0.45%, in line with Q4FY25 levels.
Conclusion
As of Q1FY26, credit offtake grew 9.5% y-o-y, slightly lagging deposit growth at 10.1%, with growth expected to remain moderate ahead. Asset quality stayed strong, supported by healthy recoveries and contained incremental slippages. The SCB GNPA ratio is projected to remain in the 2.3%–2.4% range by FY26-end, as stress in unsecured personal loans and MFIs is offset by corporate deleveraging and a declining GNPA stock. Clean-up of stressed assets, which commenced more than a decade back, and changes in regulations strengthening the creditor rights have played out in the banking system. Improvement in Credit cost has peaked out and the latest trends were mixed, as PSBs saw stable or lower costs from improved asset quality, while PVBs faced higher provisions due to increased slippages. However, key downside risks include continuing/higher weakness in the low-ticket unsecured space, U.S. tariff changes, global slowdown risks, and regulatory changes that could weigh on asset quality and credit growth.
Above views are of the author and not of the website kindly read disclaimer