Copper trading range for the day is 857.4-870.2 - Kedia Advisory

Gold
Gold prices edged higher by 0.14% to settle at Rs 95,278, supported by bargain buying as traders positioned themselves ahead of key macroeconomic data releases, including the U.S. Fed’s FOMC minutes and upcoming PCE inflation data. The Federal Reserve minutes revealed elevated concerns regarding the economic impact of unexpected and extensive tariff hikes, with policymakers highlighting rising risks to both inflation and employment. This heightened policy uncertainty is boosting gold’s appeal as a safe-haven asset. Goldman Sachs reiterated its bullish stance on gold, recommending a higher portfolio allocation amid persistent pressure on the Fed and sustained central bank demand. Meanwhile, Switzerland's gold imports from the U.S. surged to 63 metric tons in April—the highest monthly level since 2012—following the removal of tariffs on precious metals. However, Swiss gold exports fell sharply, especially to the U.S., signaling shifting global trade flows. Physical demand in India remained weak due to a stronger gold price and a depreciating rupee, widening the local market discount to as much as $49/oz. In contrast, premiums in top consumer China held firm, reflecting strong underlying demand. Technically, the market saw short covering, as open interest dropped significantly by 40.13% to 4,022 contracts. Gold finds support at Rs 94,900, with further downside potential to Rs 94,520. On the upside, resistance is seen at Rs 95,760, and a break above could lead to a test of Rs 96,240.
Trading Ideas:
* Gold trading range for the day is 94520-96240.
* Gold rose as traders bought dips ahead of key Fed meeting minutes release.
* Goldman Sachs advised higher gold allocation due to rising institutional and geopolitical risks.
* Gold imports to Switzerland from the United States jumped to the highest monthly level since at least 2012 in April
Silver
Silver prices edged lower by 0.23% to settle at Rs 97,255 as market participants adopted a cautious stance ahead of key U.S. economic data releases, particularly the Federal Reserve's meeting minutes and the core PCE inflation index due Friday. While progress in trade negotiations and improved sentiment provided some support, uncertainty around U.S. monetary policy and President Trump’s unpredictable tariff decisions kept investors on edge. Fed officials expressed mixed views—some advocating for patience amid rising tariffs, while others hinted at possible rate cuts later in the year, which could lend medium-term support to precious metals like silver. On the industrial front, silver demand received a boost from robust clean energy expansion in China, where wind and solar power capacity surged to 1,500 GW in Q1, including a 60 GW rise in photovoltaic installations. According to the Silver Institute, silver is poised to experience its fifth consecutive annual deficit in 2025, with the gap narrowing to 117.6 million ounces. Industrial demand is projected to remain strong, hitting a new high above 700 million ounces, even as jewelry and silverware demand declines—especially in India, where high prices have curbed retail interest. Technically, silver is witnessing fresh selling pressure with a 2.95% rise in open interest to 18,485, while prices slipped Rs 220. Immediate support lies at Rs 96,845, below which it may test Rs 96,435. Resistance is pegged at Rs 97,925, with a break potentially pushing prices to Rs 98,595.
Trading Ideas:
* Silver trading range for the day is 96435-98595.
* Silver dropped as investors await Fed minutes and core PCE inflation data Friday.
* Fed officials emphasize decisive action if inflation diverges from 2% target.
* Fed’s Waller sees potential for rate cuts depending on tariff-driven inflation impacts.
Crude oil
Crude oil prices surged by 2.22% to settle at Rs 5,306, driven by a combination of geopolitical tensions, production disruptions, and shifting expectations around OPEC+ output decisions. The U.S. decision to bar Chevron from exporting Venezuelan crude under its revised license added supply constraints to the market. At the same time, Canadian production shut-ins further tightened global availability. Anticipation is building around the upcoming OPEC+ meeting, where a production increase of 411,000 barrels per day in July is likely, though Russian officials suggest no formal discussions have occurred yet. Meanwhile, broader macroeconomic and geopolitical dynamics are influencing sentiment. Goldman Sachs analysts believe OPEC+ may opt for steady output post-July due to slowing global growth and higher oil inventories. In parallel, rising friction between the U.S. and Russia and the potential for fresh sanctions have added geopolitical risk premium to prices. On the inventory front, U.S. EIA data showed an unexpected build of 1.3 million barrels in crude stocks, defying expectations of a draw. Gasoline and distillate inventories also rose, highlighting tepid demand or overproduction. The International Energy Agency (IEA) noted that economic headwinds and rising EV sales will slow global oil demand growth to 650,000 barrels per day for the remainder of 2025. Technically, the crude oil market is in short covering mode, with open interest down 16.43% to 11,483 while prices rose Rs 115. Support is at Rs 5,229, and a break below could test Rs 5,152. Resistance is seen at Rs 5,368, with a potential upside to Rs 5,430.
Trading Ideas:
* Crudeoil trading range for the day is 5152-5430.
* Crude oil rose as U.S. barred Chevron from exporting Venezuelan oil, tightening supply.
* Canadian production shut-ins and geopolitical risks support prices despite rising global inventories.
* OPEC+ expected to approve 411,000 bpd hike for July; formal talks still pending.
Natural gas
Natural gas prices declined sharply by 3.36% to settle at Rs 305.3, pressured by expectations of lower demand and only a modest drop in output. Despite falling from a record April high, gas production in the Lower 48 U.S. states remains strong, averaging 105.0 billion cubic feet per day (bcfd) so far in May. A recent daily output dip to 103.7 bcfd failed to provide substantial price support, as demand forecasts turned softer. LSEG revised its forecast for U.S. gas demand, including exports, to drop from 96.1 bcfd this week to 95.7 bcfd next week, driven by expectations of moderate weather through June 12. Additionally, LNG export volumes eased to 15.1 bcfd in May, down from the record 16.0 bcfd in April, reflecting reduced global demand or logistical constraints. Gas inventories continue to build at a solid pace. U.S. utilities added 120 billion cubic feet (bcf) to storage for the week ending May 16, marking the largest pre-summer build since 2015 and beating expectations of a 115 bcf rise. Current storage stands at 2.375 trillion cubic feet—up 4% from the five-year average, though still 12.3% below year-ago levels. Technically, the market is under fresh selling, with open interest up 17.51% to 12,032, indicating increased bearish positioning. Support is at Rs 297.3, with a break potentially testing Rs 289.4. Resistance is seen at Rs 320.3, and a move above that could push prices toward Rs 335.4.
Trading Ideas:
* Naturalgas trading range for the day is 289.4-335.4.
* Natural gas fell on smaller output decline and reduced demand forecast for this week.
* U.S. gas production dropped to 103.7 bcfd Wednesday, lowest in two months.
* LNG export plant flows dropped to 15.1 bcfd in May from 16.0 bcfd in April.
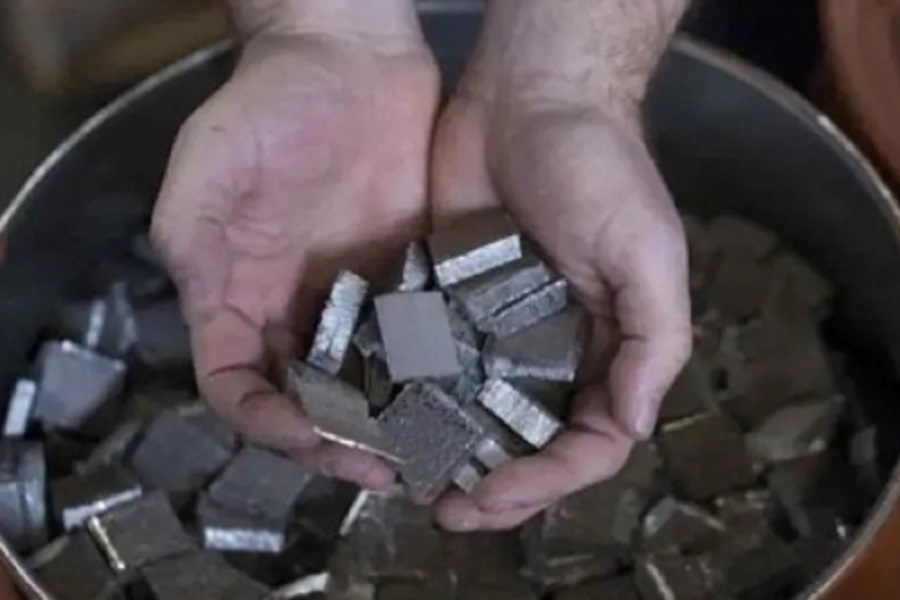
Copper
Copper prices declined marginally by 0.16% to Rs 862.65 amid rising global economic and trade uncertainties, with risk-off sentiment weighing on market sentiment. A key contributor to this volatility was the unexpected delay by former President Trump in implementing a 50% tariff on EU imports, now postponed to July 9. Meanwhile, China and the EU are seeking to strengthen trade relations in response to rising U.S. protectionism, a dynamic that could reshape global copper trade flows. On the supply side, the International Copper Study Group (ICSG) revised its 2025 surplus forecast to nearly 300,000 tonnes, highlighting strong ore output from South America. Meanwhile, copper inventories are showing divergent trends: Shanghai Futures Exchange (SHFE) stocks fell 9% to 98,671 tons, and LME stocks dropped 8% to 164,725 tons, while COMEX inventories surged to 174,607 tons—their highest since 2018—driven by traders shipping metal to the U.S. in anticipation of tariff-induced price increases. Globally, the refined copper market posted a modest surplus of 17,000 metric tons in March, down sharply from 180,000 metric tons in February. Notably, China’s copper imports remained flat in April at 438,000 metric tons, but cumulative imports for 2025 are down 3.9% year-on-year. Technically, the copper market is under fresh selling pressure, marked by a 2.25% rise in open interest to 6,601 contracts. Immediate support is at Rs 860.1, with further downside possible to Rs 857.4. Resistance lies at Rs 866.5, and a break above this could push prices towards Rs 870.2.
Trading Ideas:
* Copper trading range for the day is 857.4-870.2.
* Copper dropped as risk-off sentiment deepened amid global trade and economic uncertainty.
* Copper surplus forecast doubled to 300,000 tonnes amid strong South American ore output.
* COMEX copper inventories surge 87% since February, nearing LME levels for first time since 2022.
Zinc
Zinc prices declined by 0.58% to Rs 255.35, weighed down by a stronger U.S. dollar and persistent uncertainty surrounding global trade policies. Although President Donald Trump's decision to postpone the imposition of 50% tariffs on European Union imports has temporarily eased tensions, the lack of clarity beyond a 90-day trade truce between the U.S. and China continues to pressure market sentiment. This cautious tone has tempered investor optimism despite signs of tighter physical supply. Fundamentally, zinc markets are experiencing mixed signals. On the one hand, spot supply has tightened due to increased smelter maintenance, and zinc inventories in warehouses monitored by the Shanghai Futures Exchange fell 4.9% over the past week, offering some support to prices. However, expectations of rising treatment charges (TCs) for zinc concentrates and the ramp-up of new smelting capacities could result in supply outpacing demand in the near term. China’s refined zinc production rose by 1.6% month-on-month and about 10% year-on-year in April 2025. However, cumulative production from January to April grew only 0.3% YoY, below expectations. Looking ahead, May production is projected to increase modestly by less than 0.1% MoM and over 3% YoY. Technically, the market is under fresh selling pressure, as indicated by a 10.02% rise in open interest to 2,723 contracts. Immediate support lies at Rs 254.2, with a break below potentially testing Rs 253.1. Resistance is now seen at Rs 256.9, and a move above could open the path toward Rs 258.5.
Trading Ideas:
* Zinc trading range for the day is 253.1-258.5.
* Zinc dropped pressured by a firmer dollar and uncertainty over U.S. tariffs.
* China's industrial profits picked up pace in April, official data showed.
* Zinc inventories in warehouses monitored by SHFE fell 4.9% from last Friday, the exchange said.
Aluminium
Aluminium prices declined by 0.54% to Rs 237.6 amid a stronger U.S. dollar and investor caution ahead of fresh economic cues. The market remains sensitive to trade developments, particularly under the Trump administration’s evolving tariff policies. Despite the price dip, the downside appears limited due to tightening supply fundamentals in the alumina market. Rising alumina prices, driven by supply constraints, higher production costs, and maintenance-related output cuts in key Chinese regions like Shanxi and Guizhou, are offering cost support to aluminium prices. On the global front, aluminium fundamentals continue to reflect a supply surplus. The World Bureau of Metal Statistics (WBMS) reported a surplus of 277,300 tons in March, with global primary aluminium output at 6.16 million tons versus consumption of 5.88 million tons. The cumulative surplus for the first quarter of 2025 stood at 538,700 tons. Meanwhile, China's aluminium output rose by 4.2% YoY to 3.75 million metric tons in April and 14.79 million metric tons for the January–April period, up 3.4% from a year earlier. Exports also remained strong, growing 17% YoY in the first ten months of the year. Inventory levels further highlight the market's supply dynamics. Stocks at Japan’s three major ports climbed 3.4% MoM to 320,300 metric tons by the end of April. Technically, aluminium is under fresh selling pressure, with open interest rising 3.21% to 4,443 contracts. Immediate support is at Rs 236.4, with further downside likely toward Rs 235.2. On the upside, resistance is at Rs 239.5, and a break above may push prices toward Rs 241.4.
Trading Ideas:
* Aluminium trading range for the day is 235.2-241.4.
* Aluminium fell as dollar firmed, with traders awaiting catalysts amid trade and fiscal concerns.
* WBMS reported Q1 aluminium surplus of 538,700 tons due to higher global production.
* China’s aluminium output rose 3.4% YoY to 14.8 million tons during Jan-April
Cottoncandy
Cottoncandy futures declined by 0.27% to settle at Rs 54,520, pressured by bearish supply-demand dynamics and long liquidation in the market. The Cotton Association of India (CAI) marginally revised India’s cotton production upward to 291.35 lakh bales from 291.30 lakh bales, citing increased output from Odisha. While this increase is minimal, the broader sentiment is affected by weakening demand indicators. Notably, the CAI reduced its cotton consumption estimate by 8 lakh bales to 307 lakh bales for the current season and trimmed export expectations by 1 lakh bale to 15 lakh bales, reflecting sluggish trade activity. India’s cotton exports are projected to fall sharply from 28.36 lakh bales last season, indicating a steep 13.36 lakh bale decline this year. On the import front, the CAI maintained the estimate at 33 lakh bales, with 27.5 lakh already imported by April—nearly double last year’s levels. Ending stocks are forecasted to rise to 32.54 lakh bales by September 30, 2025, suggesting supply accumulation due to lower consumption and exports. Internationally, the U.S. reduced export projections by 100,000 bales, raising ending stocks to 5.0 million bales, while global cotton production, consumption, and trade were all revised downward. Technically, the market experienced long liquidation as open interest plunged by 20.88% to 72 lots. Prices are currently finding support at Rs 54,370, with a break below likely to test Rs 54,220. On the upside, resistance is seen at Rs 54,610, and a move above this could lift prices toward Rs 54,700.
Trading Ideas:
* Cottoncandy trading range for the day is 54220-54700.
* Cotton prices dropped after India’s production estimate rose slightly to 291.35 lakh bales.
* CAI cut consumption forecast by 8 lakh bales to 307 lakh for the 2024–25 season.
* Cotton exports expected to fall to 15 lakh bales, down 13.36 lakh from last year.
* In Rajkot, a major spot market, the price ended at 25949.8 Rupees gained by 0.12 percent.
Turmeric
Turmeric prices rose by 1.41% to settle at Rs 13,906, driven by persistent concerns over lower production and limited arrivals. Despite the increased area under turmeric cultivation this season—estimated at 3.30 lakh hectares, up 10% from last year—production is unlikely to see a proportional rise. Untimely rains have impacted crop yields, with regions like Nanded reporting 10-15% lower output due to small rhizomes and crop rot. These factors have contributed to firming prices despite a recent uptick in daily arrivals. Arrivals surged to around 57,500 quintals from 29,860 quintals in the previous session, weighing on prices temporarily. However, the superior quality of the new crop, especially at markets like Duggirala, has maintained buyer interest. New stock is fetching better prices than older inventory, highlighting strong demand for quality produce. So far, 50–55% of the new crop has been traded, with arrivals and trading activity expected to continue steadily through June. On the export front, turmeric shipments showed healthy annual growth of 8.83% in the 2024–25 fiscal year, reaching 176,325 tonnes. March 2025 exports were up 20.39% over February, despite a year-on-year dip of 13.41%, indicating continued international demand. Technically, the market is under short covering, with a 1% drop in open interest to 15,290 contracts as prices gained Rs 194. Turmeric finds support at Rs 13,686, with further downside risk to Rs 13,466, while resistance is seen at Rs 14,040, and a breakout could lead to testing Rs 14,174.
Trading Ideas:
* Turmeric trading range for the day is 13466-14174.
* Turmeric gained amid persistent concerns about low arrivals and lower production estimates.
* However upside seen limited due to increased arrivals and owing to weak export enquiries.
* Turmeric exports during Apr - Mar 2025, jump by 8.83 percent at 176325.34 tonnes compared to Apr - Mar 2024.
* In Nizamabad, a major spot market, the price ended at 14191.45 Rupees dropped by -0.72 percent.
Jeera
Jeera prices fell by 0.53% to settle at Rs 20,570, pressured by weak domestic buying and subdued export demand. The conclusion of the retail season and continued inactivity from foreign buyers have further dampened market sentiment. In addition, total arrivals in major mandis increased to 32,900 bags, up from 28,000 in the previous session, adding to the supply-side pressure. Despite the delayed sowing in Gujarat and Rajasthan due to unfavorable weather, overall crop conditions are reported to be satisfactory, suggesting production levels comparable to last year. A notable factor contributing to market softness is the large carry-forward stock. Farmers currently hold about 20 lakh bags of cumin, with only 3–4 lakh bags expected to be traded by season-end, leaving a significant surplus of around 16 lakh bags. While demand remains low, the existing export commitments are being met from ample stock, further reducing the urgency for fresh buying. On the trade front, jeera exports during April–March 2025 rose by 39.63% year-on-year to 2,12,502 tonnes, reflecting robust export performance over the fiscal. However, March 2025 exports dropped sharply by 46.03% compared to the same month in 2024, signaling recent weakness in international demand. Technically, the market is under long liquidation, with open interest falling by 1.52% to 6,231 as prices declined Rs 110. Jeera finds immediate support at Rs 20,490, and a break below could test Rs 20,420, while resistance is seen at Rs 20,680; a move above this could lead to a test of Rs 20,800.
Trading Ideas:
* Jeera trading range for the day is 20420-20800.
* Jeera dropped due to lower buying and weak export demand.
* The current season is expected to have similar production levels as last year due to better crop conditions.
* Jeera exports during Apr - Mar 2025, rose by 39.63 percent at 212502.49 tonnes compared Apr - Mar 2024.
* In Unjha, a major spot market, the price ended at 21163.4 Rupees dropped by -0.46 percent.
Views express by all participants are for information & academic purpose only. Kindly read disclaimer before referring below views