Cooling Trend Continues with a Sequential Rise in June 2025 by CareEdge Ratings
Synopsis
* Credit growth continued to moderate in June 2025, with non-food credit growth easing to 9.3% year-on-year (y-o-y), a significant drop from 17.3% (13.9% excl. merger) recorded in June 2024. In agriculture, the deceleration was partly driven by the reclassification of agri-gold loans under personal loans.
* Services sector growth eased, especially for NBFCs and commercial real estate, while personal loan growth weakened across mortgages, consumer durables, and credit cards.
* This broad-based slowdown can be attributed to a combination of factors, including a high base effect, subdued demand, and a cautious approach by banks towards managing the Credit-to-Deposit (CD) ratio, which continues to hover near the 80%-mark.
* Pricing pressure has also led banks to adopt a more conservative lending stance to preserve margins. On the demand side, credit uptake remained weak across key segments such as commercial real estate, NBFCs, and personal loans. Notably, gold loans (within personal loans) stood out as the only sub-segment maintaining robust growth in June 2025.
Figure 1: Gross Bank Credit Uptake Continues to Soften (y-o-y growth %)
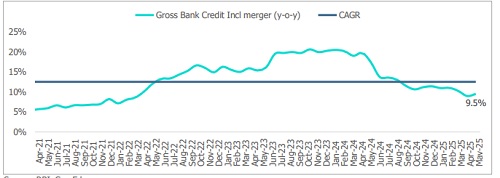
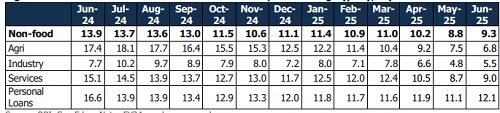
Figure 2: Broad-Based Slowdown with Minor m-o-m Uptick excl. Agri (y-o-y, %)
The gross credit offtake has continued to moderate, reaching 9.5% in June 2025 after expanding in the range of 10%-16% over the past couple of years. This deceleration can primarily be attributed to a slowdown in the large industries, NBFCs, commercial real estate, housing, vehicle, and other personal loan segments. In June 2025, nonfood bank credit grew by 9.3% compared to 13.9% in the same period a year ago.
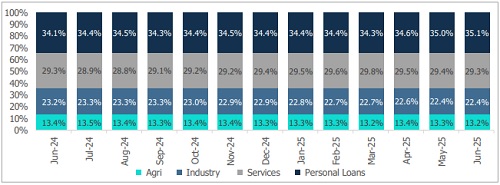
Figure 3: Personal Loans Remain the Largest Segment in Bank Credit, while Services Shrinks Marginally (%)
Credit to Industry Grows at a Slower Pace
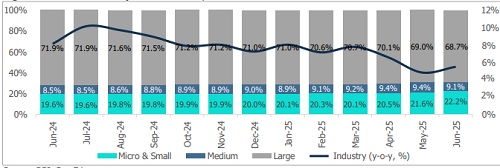
Figure 4: Overall Industry Growth Slows; Share of MSMEs Increases
In June 2025, credit outstanding to industry fell to 5.5% compared to 8.1% (7.7% excluding merger) in the yearago period, driven by a pronounced slowdown in the capex spending and infrastructure segments. Among major sectors, outstanding credit to mining and quarrying, food processing, beverages and tobacco, petroleum, coal products, nuclear fuels, chemicals and chemical products, glass and glassware, cement and cement products, basic metal and metal products decelerated, which was only partially offset by the textiles, wood and paper products, rubber and plastic products, engineering, electronics, construction and gems and jewellery, which recorded yearover-year growth.
Figure 5: Sluggish Large Industry Offset by MSME Growth (y-o-y, %)
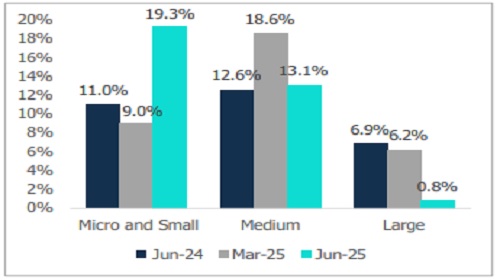
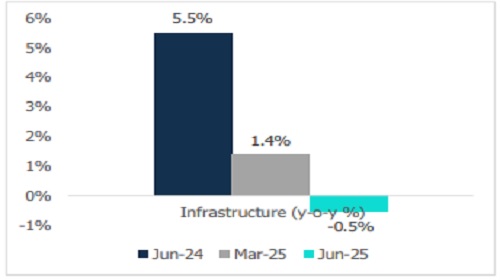
Figure 6: Infrastructure Sees Contraction (y-o-y, %)
* The MSME segment has generally continued to outpace the large segment, leading to a shift in the credit composition. The share of large industry in overall industrial credit declined from 71.9% in June 2024 to 68.7% in June 2025, reflecting a relative increase in the MSME share contributing to growth in the MSME sector. This shift is driven by policy support measures such as ECLGS and CGTMSE, rising formalisation of small businesses, and comparatively subdued credit demand from large corporates.
* The infrastructure sector, accounting for 33.5% of overall industry credit, saw a y-o-y contraction of 0.5% in June 2025, a reversal from 5.5% growth a year earlier. Within this, the power sector, comprising 52.8% of infrastructure credit, grew modestly at 7.6%, down from 3.3% in June 2024. In contrast, credit to the roads segment declined by 5.7% y-o-y, following an 8.8% growth seen in the previous year, with similar weakness observed in the ports, railways, telecommunications and other infrastructure sectors. The contraction reflects a combination of high base effects and shifting to alternative funding.
Services Sector
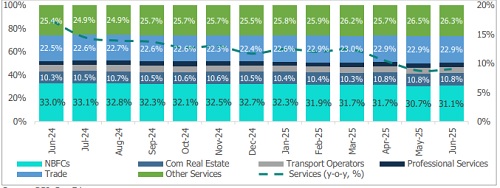
Figure 7: The Share of NBFCs Slightly Edges Up in June 2025
Growth in the services sector moderated to 9.0% in June 2025, nearly half of the 17.4% (15.1% excluding merger) rate reported a year ago, primarily due to a decline in lending to NBFCs, commercial real estate and other services, and was only mitigated in part by growth in the computer software and shipping, aviation.
Figure 8: NBFCs Credit Growth Witnessed a m-o-m Uptick in June 2025 (y-o-y, %)
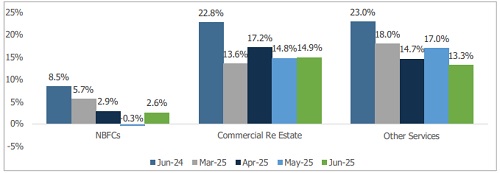
* Bank lending to NBFCs saw a month-on-month(m-o-m) uptick in June 2025, but the y-o-y growth moderated. Outstanding credit to NBFCs stood at Rs 15.9 lakh crore, reflecting a modest 2.6% increase compared to 8.5% growth in June 2024. For over a year, credit flow to NBFCs has consistently lagged overall bank credit growth, constrained by regulatory tightening, an unfavourable base effect, and a shift towards foreign and capital market funding. NBFCs’ share in total bank credit declined from 9.2% in June 2024 to 8.6% in June 2025. While the partial rollback of risk weights signals RBI’s confidence, sustained growth remains unlikely, as banks remain cautious toward smaller NBFCs and those exposed to MFIs, consumer credit, and unsecured personal loans. Meanwhile, larger NBFCs are increasingly turning to capital markets for cheaper funding and greater diversification, further limiting their reliance on bank credit.
* Outstanding credit to the commercial real estate segment stands at Rs 5.5 lakh crore, with growth moderating to 14.9% in June 2025, down significantly from 40.7.% in the same period last year (22.8% excluding merger), reflecting a continued slowdown in the segment.
Above views are of the author and not of the website kindly read disclaimer