Commodity Weekly Report 21th September 2025 by Choice Broking

Gold
Gold's record-breaking rally cooled after the Fed's 25-bps "risk-management cut" came across as cautious rather than aggressively dovish While a slowing U.S. job market and lingering tariff-related price pressures could still force deeper easing later this year, bullion's next leg higher depends squarely on incoming economic data.
Comex Gold spot has continued its steady upside momentum, made a positive closing for 5th consecutive week, closed with marginal surge with +1.14% at $3684/ounce.
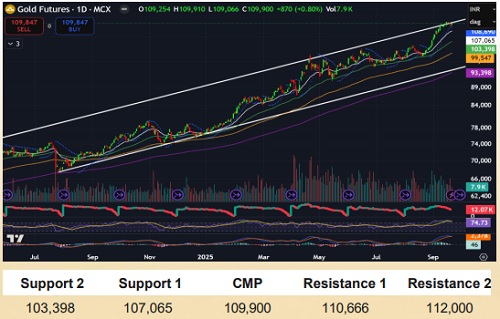
Gold price made its new all-time high in previous week at 110,666 in Indian market, experienced some profit booking in mid part of the week and managed to close on positive note at Friday at 109,900. MCX Gold October contract has continue to trade in Rising channel and maintained over its all key moving averages ie. 50, 100 and 200-DEMA levels placed at 103398 99547 and 93398 Daily SAR is placed at 108690.
Looking at Ol, we can observe a decline in Oi levels to 12,070 lots in past couple of weeks momentum where price is in run of making new ATHS. This is cautionary sign for Traders to build new long position. Adding to this, we can observe a convergence on MACD above zero-line along side declining positive histograms. RSI levels remains over 70 on Daily and Weekly chart.
The overall trend in Gold price is expected to be Moderately Bullish in the coming week, and traders should keep an eye on key US economic data such as Final GDP, Price Index, Personal spending, Flash Manufacturing and Services PMI, Durable goods order, and Unemployment claims which are scheduled to be relecsein next week.
Silver
Silver followed gold's lead, slipping as the Fed signaled a more measured pace of future cuts. With investors weighing the balance between a cooling labor market and sticky inflation, silver's direction will largely mirror gold's data-driven path.
Comex Silver spot has settled on a positive note past week, posted weekly rise for 5th consecutive week, managed to settle at $4305/ounces. Here, key support would be at 20-DEMA level placed at 40.96.
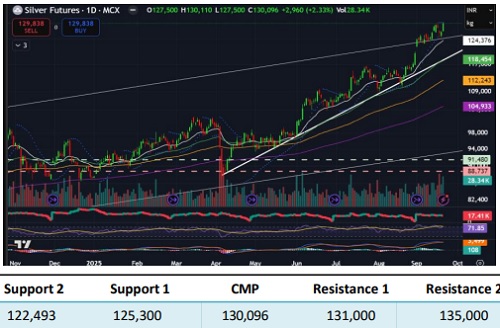
MCX Silver December future has been on a strong upward trajectory, closing positively for the fifth consecutive week. It recently hit a new all-time high in the Indian market at 130,450 before closing at 130,096. Following this peak, the price saw some temporary profit-booking but found solid support around 125,300. The current trend remains bullish as the price continues to trade above its 20-day exponential moving average (DEMA), which sits at 124,376 and acts as an immediate support level. If the price breaks above the previous all-time high with significant long positions, it could accelerate further into uncharted territory. potentially reaching 135,000 in the near term The momentum is supported by RSI, which is holding strong between 70 and 80 on both the daily and weekly charts However, MACD shows a convergence above the zero line with declining positive histograms, suggesting a potential slowdown in the current bullish momentum
Gold-Silver ratio, also known as the Mint ratio, has been in a steady decline for the past five months, reaching a new monthly low of 85.52 last week. This consistent drop clearly indicates that silver is outperforming gold, highlighting its stronger momentum in the market.
Overall trend in Silver price is likely to remain Moderately Bullish and traders may opt for Buy-on-dips opportunity in any throwback towards the Support levels.
Copper
Chile's copper sector is regaining momentum despite recent mine disruptions, with officials projecting steady output growth and record production by 2027. Strong long-term demand from the energy transition and Al infrastructure underpins a constructive medium-term outlook.
MCX Copper September contract has experienced a massive profit-booking post making high at 92150 at the starting of the week, found support over 899.60 and closed at 907.10. On Weekly timeframe, we can observe a Dark cloud cover candle formation which may act as a early sign of Bearish reversal Here, price has continued to maintain over key moving averages i.e. 50, 100 and 200-DEMA levels placed at 894.50, 884,75 and 868.35 respectively. Daily SAR is placed on the opposite side at 920.65.
In recent price momentum, we can observe a significant Long unwinding to 2990 lots. RSI levels remains around 55-60 levels on Daily and Weekly chart. Also, we can observe a bearish crossover on MACD along side emergence of negative histogram on Daily timeframe. These collectively suggests a bearish biasness in Copper price and profit-booking may continue in upcoming sessions.
We are expecting Moderately Bullish trend in Copper price in upcoming sessions and expecting correction towards support levels in next week If price holds over these levels, it may provide a Buy-on-dips opportunity for Copper price.
Zinc
In September, domestic zinc concentrate TCs reversed their 10-month uptrend, declining as smelters actively sourced local material amid falling zinc prices and compressed mining profits. Looking ahead to Q4, domestic TCs may continue to ease due to routine mine suspensions, while imported zinc concentrate TCs could see upside supported by persistently poor import economics and traders raising offers.
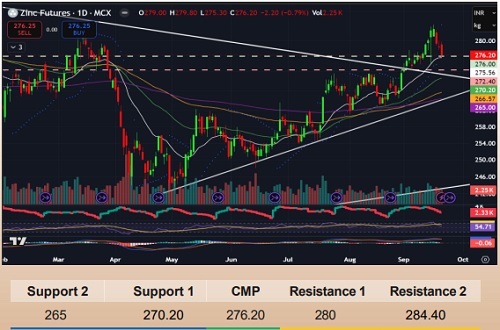
MCX Zinc September contract has shown a signs of weakness in recent sessions, experienced profit-booking from the high of 284.40, declined by nearly -3% from peak and managed to close on a negative note at 276.20. Price has hold right above 20-DEMA level placed at 275.55 on Friday. Breakout below this level will boost downside move in Zinc price and price may move towards its next supports at 50 and 200-DEMA levels placed at 270.20-265 respectively. Daily SAR is placed at 284.20 which will be crucial resistance to look for.
The momentum indicator, RSI is trailing downwards towards 50 level on Daily and Weekly timeframe. Also, we can observe a bearish crossover on Daily MACD alongside emergence of negative histograms. These collectively suggests bearish biasness in Zinc price.
Looking ahead, we maintain a negative outlook on Zinc. Traders should continue to look for Sell-on-rise opportunities if price break through its supports.
Crude Oil
Crude prices remain range-bound as OPEC+ supply increases and weak demand temper gains. Yet geopolitical risks from Ukrainian drone strikes to fresh sanctions talk on Russian exports keep an upside possibility alive despite hedge funds trimming bullish bets to record lows.
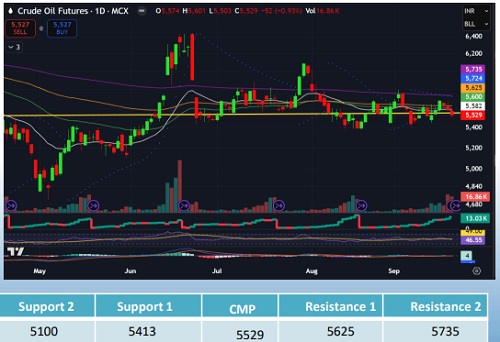
After a brief upside momentum in the beginning of the week, WTI Crude oil future has continued its Moderately bearish trend and managed to settle at $62.67/ barrel Crucial resistance would be 200-DEMA level placed at $66.88. On the other side, MCX Crude oil future has resumed on a positive note past week, made a high at 5686, posted decline in last three consecutive sessions and closed at 5529.
MCX Crude oil October contract has remained in its Moderately Bearish trend and continue to trade below its key moving averages i.e. 50, 100 and 200-DEMA levels placed at 5600, 5625 and 5735 respectively. Here. Daily SAR is also placed at 5724 which will be critical hurdle to look for. In previous week, Crude price has hold above 5413 which will be key support mark and breakout below this support will boost downside momentum in Crude oil price towards its next support at 5100.
Recent price action in Crude Oil shows a Moderately bearish trend, supported by several key indicators. A notable increase in open interest to 13,030 lots suggests that traders are predominantly building Short positions. Furthermore, RSI remains below 50 levels on Daily, weekly and Monthly timeframe. Also, we can observe a bearish crossover above zero-line along side negative histograms.
We are expecting Moderately bearish trend in Crude oil in upcoming sessions, Price may take temporary pullbacks towards its resistance levels which should be considered as a Sell-on-rise opportunity.
Natural Gas
Natural gas trades cautiously with markets eyeing winter demand patterns. Recent price moves reflect shifting weather expectations more than any structural supply shock. Meanwhile, Europe plans to accelerate its ban on Russian LNG to January 2027, following U.S. pressure, targeting Russia's energy revenues while prompting EU countries to secure alternative supplies likely boosting dependence on U.S. gas.
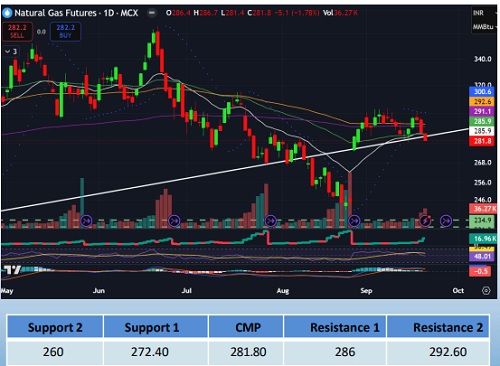
MCX Natural gas October contract has negative closing for the 3rd consecutive week, holding resistance over 300 level. Natural gas price has posted marginal decline in past week, forming Bearish Hammer formation on Weekly chart and managed to settle on negative note at 281,80. Price has posted upside momentum till the mid of the week, hold resistance at 300.60 and declined by -6.40% by weekend. Price has remained below its key moving averages ie. 50, 100 and 200-DEMA levels placed at 285.90, 292.60 and 291.10 respectively. Here, we can also observe a Double top price formation which has a neckline-support right at 281. Daily SAR is placed at 300.60 which will be crucial resistance to look for. Immediate support would be at 272.40 and breach of this level will accelerate downside trend in Natural gas price.
With recent fall, we can observe a significant Short buildups to 16,960 lots in Natural gas which signifies overall weakness in Natural gas price. RSI is currently trailing at 48 level on Daily chart. Also, we can observe a bearish crossover on MACD above zero-line alongside emergence of negative histograms which collectively suggests bearish biasness in Natural gas
We are expecting moderately bearish trend in Natural gas in upcoming sessions and traders may look forward for Sell-on-rise strategy.
For Detailed Report With Disclaimer Visit. https://choicebroking.in/disclaimer
SEBI Registration no.: INZ 000160131