Commodity Weekly Report 08th December 2025 by Choice Broking

Gold
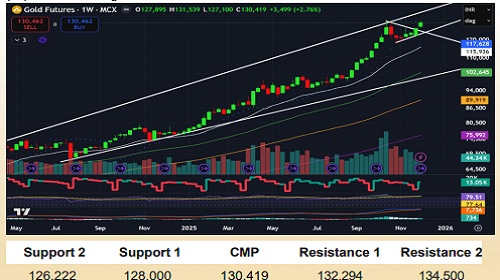
This week gold held slightly above $4,200 in a turbulent, consolidative range as traders positioned ahead of the postponed September PCE data Gold has maintained a buy due to the dollar's weakening near a five-week low, while downside interest has been restrained by continued predictions of another 25-bp rate drop next week While unemployment claims declined to 191000 in November, private payrolls fell by 32,000. This decline was skewed by the holiday week, but it nevertheless supported forecasts for policy easing. A quarter-point decrease is priced with around 90% confidence in futures markets. With the 10-year at 4.302%, this bias has exceeded Thursday's yield increase. The Fed has already lowered rates at its last two sessions despite stickier inflation, and members continue to express concern about a deteriorating labor market.
MCX Gold February contract has continued to incline for the 4th consecutive week, posted a mild surge of 0.63% and managed to settle at 130,419 in past week. Price has made an effort to peak of 131,539 ahead of Fed rate announcement, however experienced sell-off from peak. On Weekly chart, price has made a Bullish Spinning top candle and price has continued to move above its all key moving averages ie. 20, 50 and 100-DEMA levels placed at 126222, 122055 and 115470, Here, key resistance would be at previous ATH level ie. 132,294 and breakout of this level will accelerate upward momentum in Gold price ahead to 134,500.
We can observe a mild rise in Ol levels to 13,050 lots in Friday's session along with a price-rise which signifies a strength in a bullish momentum. Dollar Index has remained weaken for second week, made a dip at 9841 which will provides add-on strength to Gold price.
The overall trend in Gold price is expected to be Moderately Bullish in the coming week, and traders should keep an eye on key US economic data such as Job openings, Employment cost index. unemployment claims along with announcement of Fed rate which are scheduled to be releasein next week.
Silver
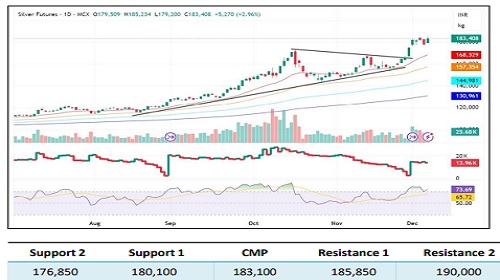
COMEX Silver posted another strong week, marking a fresh all-time high at $59.33/oz after taking support near $56.50. Prices surged +5% during Friday's session and closed the week at $58.29, holding firmly above immediate support at $57.72-$56.50. The daily structure remains strongly bullish with price action staying above key short-term support zones, signaling sustained upward momentum.
MCX Silver Futures- March contract mirrored this strength, rallying +9,367 points over the week and registering an all-time high at 185,234 before closing at 183,408. The contract is comfortably positioned above all major moving averages-20-DEMA at 168,330; 50-DEMA at 157,350; 100-DEMA at 144,980, and 200-DEMA at 130,960 confirming a well-established and healthy uptrend The rising channel structure on the daily chart continues to support higher highs and higher lows. Open interest contracted by roughly 1,000 lots during the rally, suggesting the recent upside was driven more by short-covering and momentum participation rather than fresh long buildups. From an indicator perspective, RSI has climbed to the upper 60s-70s range (around 73+). reflecting strong bullish momentum while entering an overbought zone, consistent with trending-market behavior. The MACD histogram remains firmly positive, signaling trend continuation, and volume spikes accompanying the breakout validate growing participation
The Gold/Silver ratio (Mint Ratio) dropped sharply to a new low at 71.66, recording a -32% weekly decline. This relative weakness in gold underlines Silver's strong outperformance in the precious-metals segment.
Overall, the trend for Silver remains decisively bullish, with the structure favoring a buy-on-dips approach as long as prices sustain above immediate support clusters and momentum indicators remain constructive.
Copper
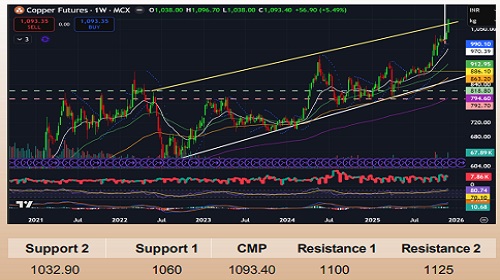
Copper prices in the US surged to $11,540 per ton, reaching multi-month highs due to concerns about potential import tariffs on refined copper amidst tight global supply. Prices have risen over 30% this year, influenced by mine outages and strong demand from power grids, data centers, and the electric vehicle sector. A 50% tariff on semifinished and derivative copper was imposed in August, though refined copper was initially excluded. The White House is contemplating a phased universal duty on refined copper by January 2027. Global copper inventories have increased to over 656,000 tons, the highest since 2018, with about 60% stored in US Comex warehouses.
MCX Copper December contract has been traded in a bullish trend for the 2nd consecutive week, incline by +5.49% and closed on a positive note at 1093.40. Price has continued to trade over its all key moving averages i.e. 20, 50 and 100-DEMA levels placed at 1032.90, 1001.40 and 965.70 respectively. Copper price has traded in a Rising channel over past couple of years and with Friday's closing, we can observe a breakout over a resistance-line of the channel. Daily SAR is placed at 102250. Immediate upside hurdle would be at psychological level of 1100 and if price sustains over this mark. we may expect further up move towards 1125.
Looking at Ol levels, we can observe gradual decline in Ol levels of December contract to 7860 lots in recent bullish momentum which signifies a Long unwinding in Copper. RSI levels are already near to 80 levels on Daily and Weekly timeframe.
We are expecting Moderately Bullish trend in next week in Copper and traders may look for Buy-on-dips opportunity.
Aluminium
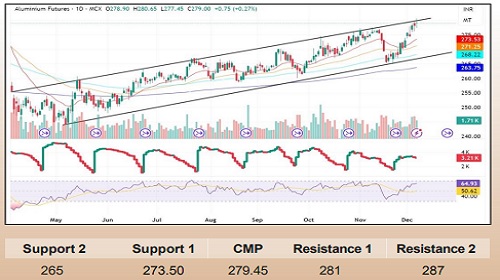
Aluminium Futures continued their upward momentum for the second consecutive week, posting a healthy +2.5% gain and marking a weekly high at 280.65, before closing strongly at 279. Price action remains firmly positioned within the broader ascending parallel channel, reflecting sustained strength, although a decisive breakout is yet to occur as volumes remain moderate. The contract continues to remain comfortably above all major daily moving averages-20, 50, 100, and 200 DEMA, placed at 273.50, 271.25, 268.20, and 263.75, respectively-underscoring strong structural support in the ongoing uptrend.
Open interest witnessed a marginal decline of -230 lots even as prices moved higher, suggesting long unwinding at elevated levels rather than aggressive fresh buying. Despite this, price continues to follow the rising channel pattern, forming higher highs and higher lows. The chart shows that prices are nearing the upper boundary of the channel, making this a crucial zone for assessing potential breakout attempts or short-term profit-booking. RSI holds firmly near the 65 zone, reflecting bullish momentum without yet entering overbought territory. MACD-style oscillator (as visible on the chart) continues to maintain positive bias, indicating continued trend strength.
Overall, indicators validate the ongoing bullish structure while highlighting the need for sustained volume for a decisive breakout above resistance. Base metals broadly maintain a bullish undertone, and buy-on-dips continues to remain the preferred strategy unless the rising channel structure breaks down
Crude oil
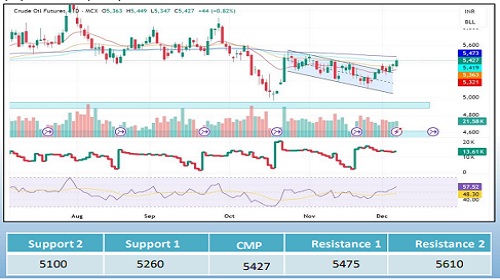
US Crude Oil posted a volatile but constructive close for the week, ending with a +3.5% rebound after finding strong buying support near $58.30. The recovery candle indicates renewed short-term strength, with the next upside hurdles placed at $60.85-$62.60. Despite the bounce, the broader trend still shows caution as prices remain below key medium-term resistances, keeping traders focused on whether momentum can sustain above the overhead supply zone.
MCX Crude Oil Futures- December delivered a decisive range breakout above 5400, gaining +189 points for the week Prices closed at 5427, holding firmly above the 20-, 50-, and 100-DEMA placed at 5321, 5363, and 5419, respectively, while still facing a major obstacle at the 200-DEMA positioned at 5475. The inability to decisively cross this long-term moving average continues to act as a crucial barrier for trend reversal attempts. Open Interest declined by -4450 lots, even as price increased a sign of short-covering led recovery rather than aggressive long accumulation.
Technical indicators remain mixed, reflecting a cautiously optimistic setup. RSI has climbed to around 57-58, exiting the weak zone and signalling improving momentum, but not yet confirming a strong bullish trend. Volumes have stabilised, showing moderate participation after the breakout, while the oscillator structure suggests early strength with no overbought signals. Price action has broken above the falling channel, yet repeated rejections near dynamic moving averages highlight that the broader trend still requires confirmation for a sustained upside. Until prices convincingly clear the 5475-5610 band, the "sell on rise bias may re-emerge near resistance.
Overall, the trend stays cautious, and traders should wait for a clear directional breakout. A reversal from resistance may offer sell-on-rise opportunities, while a decisive move above the overhead zone may open fresh buy setups.
Natural Gas
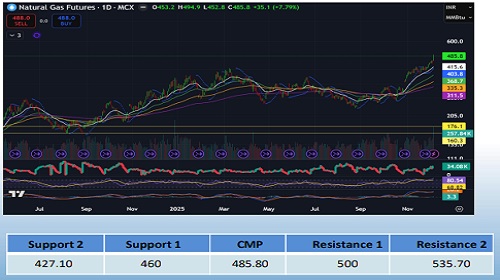
Natural gas prices reached $5.50 on Friday, the highest since late December 2022, driven by forecasts of cold weather that will increase demand for heating. A successful break above $5.45 may lead to testing the $5.90-$5.95 resistance level Prices increased by 1.36% on Thursday, supported by forecasts for below-normal temperatures from December 9-13, creating expectations for stronger heating demand. However, the EIA reported a storage draw of only 12 bcf, lower than the expected 18 bcf. indicating comfortable inventory levels. Production remains robust, with dry gas output at 111.5 bcf/day and active rigs at a 2.25-year high. Demand is also strong, with daily consumption at 118.1 bcf and supportive trends in electricity production Traders are concerned about whether demand will continue to match production levels amid the potential for further storage misses.
Natural gas price has continued to surge for 7th consecutive week, posted weekly incline of +13.93% in past week and managed to settle at 485.80. In past week, on Friday itself, price has jumped by more than 7%. Here, price has continued to trade over its all key moving averages i.e. 20, 50 and 100-DEMA levels placed at 415.60, 368.70 and 335.30. Daily SAR is placed at 403.80 currently. Major resistance would be at 535.70 and breakout of this level will stretch further bullish trend in Natural gas price.
Looking at Ol levels, we can observe a rise in Ol levels to 34,080 lots along with a price-rise which signifies strength in a bullish momentum. The momentum indicator, RSI remains over 75-80 on Daily as well as Weekly chart.
We are expecting Bullish trend in next week in Natural gas and traders may look for Buy-on-dips opportunity.
For Detailed Report With Disclaimer Visit. https://choicebroking.in/disclaimer
SEBI Registration no.: INZ 000160131