USDINR Report As On 02 nd Mar2026 By Amit Gupta - Kedia Advisory

KEDIA-ART is not conventional research — it is a structural market decoding framework designed to go beyond surface-level analysis.
What Makes ART Different?
* 360° Market Framework — Integrates fundamentals, technical structure, ratios, and macro triggers.
* Relative Strength Analysis — Studies asset relationships, not isolated price movement.
* Early Regime Detection — Identifies structural shifts before they become consensus.
* Macro + Momentum Fusion — Combines geopolitical context with indicator transitions.
* Conviction-Based Strategy — Moves from observation to actionable foresight.
ART focuses on how markets behave relative to each other, because leadership and capital rotation often appear first in ratios.
Today Under ART: We are analyzing the Brent Crude / Natural Gas ratio, a powerful inter-market signal that provides a deeper understanding of energy market direction. This ratio-based approach helps decode future structural moves with greater clarity and conviction.
KEDIA-ART - USDINR Structural Uptrend Backed by Macro Tailwinds
A — Asymmetry (Fundamental Currency Drivers)
Global Dollar Strength
* The US Federal Reserve continues a higher-for-longer stance amid sticky inflation.
* US bond yields remain relatively elevated, supporting dollar demand.
* Geopolitical tensions (US–Iran) increase safe-haven flows toward USD.
Crude Oil Sensitivity
* India imports ~85% of its crude requirement.
* Brent sustaining above $80 widens India’s trade deficit.
* Higher oil prices structurally pressure INR through rising current account deficit.
Capital Flow Dynamics
* FII flows remain volatile amid global risk reallocation.
* Strong USD environment limits aggressive INR appreciation.
* RBI likely to smooth volatility, not reverse the trend.
Macro asymmetry currently favors gradual USDINR upside bias
R — Regime Structure (Trend Behavior)
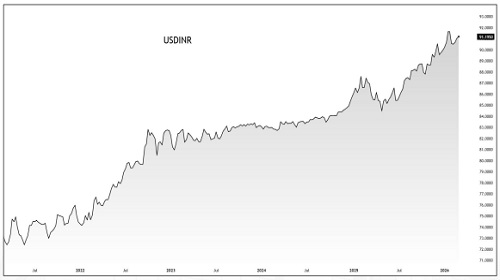
* USDINR remains inside a *rising channel formation*.
* Higher highs and higher lows intact since mid-2025.
* Price consolidating just below key breakout level 92.17.
This is structured appreciation — not disorderly depreciation.
T - Technical Confirmation
Momentum Indicators
* MACD positive crossover intact; histogram turning constructive.
* RSI at 58 → strength zone without overbought pressure.
* Price holding above cloud support.
Breakout Trigger
* Sustained close above *92.17* opens acceleration phase.
Key Levels
Suppor
* 90.30–90.50 → Immediate channel support.
* 88.95 → Structural base (61.8% retracement).
Resistance / Targets
* 92.17 → Breakout trigger.
* 94.49 → 127% extension target.
* 95.50–96.00 → Escalation projection zone.