Buy ICICI Prudential Asset Management Company Ltd For Target Rs.3,000 by Prabhudas Liladhar Capital Ltd

Position of dominance due to strong fundamentals
We initiate coverage on ICICIAMC with ‘BUY’ rating, valuing at multiple of 38x on Sep’27 core EPS to arrive at TP of Rs3,000. We are optimistic about its business prospects given (1) its strong performance/parentage which is driving the highest net equity flow market share (17.5% in 8MFY26) among AMCs; (2) its superior equity yields of 67bps due to lowest distributor payout; (3) it accounts for 73.7% of MF sales by ICICIBC due to the latter’s closed architecture; and (4) a higher share of non-MF revenue at 9.2% among peers. We expect equity AAuM CAGR over FY25-28E to be 2.5% higher than industry, leading to core PAT CAGR of 18.5%. Upper band of Rs2,165 suggests a valuation of ~27x on Sep’27 core EPS indicating 17%/16% discount to HDFCAMC (32x) and NAM (32x). ICICIAMC may eventually command a premium to HDFCAMC due to better distribution and diversification while having similar profitability
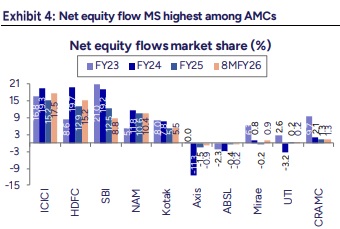
* Consistent superior performance in 1/3-yr bucket: ICICIAMC has shown the best performance in 1-yr bucket, while being ranked consistently among top 3 in the 3-yr bucket since Feb’22. In terms of quintile, 90% of equity was in Q1 as of Nov’25. Net equity flow market share in FY25/8MFY26 was highest among AMCs at 15.2%/17.5% vs. stock market share of 13.2%/13.8%. Further, its performance is more risk efficient than peers due to lower concentration risk and SMID exposure. As of Nov’25, its top 5 schemes contributed 53% to equity MAAuM vs. 64% for HDFCAMC and 71% for NAM. Also, despite having the largest equity MAAuM, ICICIAMC has the lowest SMID exposure at 36.4%.
* Solid pedigree driving better yields: Despite having largest active equity base, yields are superior at 67bps (FY25) vs 62.5bps/57.5bps/61.1bps for HDFCAMC/SBIMF/NAM, as payout ratio is lowest at 46% (vs 48%/53%/53%). This can be attributed to (1) higher banca share with strategic reliance on ICICIBC (closed architecture), higher direct mix, but lower ND share; (2) strong pedigree and consistent but superior risk-efficient performance; and (3) most no. of equity schemes (43), lower AUM size that allows higher TER. Debt yield is best at 32.6bps led by better 3-yr performance. Hence, ICICIAMC has highest MF yield at 47.4bps (HDFCAMC: 46.5bps, NAM: 37.4bps).
* Strong parentage supporting distribution: ICICIBC provides access to a vast distribution network of 7,246 branches and integration with bank’s digital platforms. Bank’s closed architecture leads to ICICIAMC accounting for 73.7% of overall MF sales by the bank and 70% of ICICIBC’s MF-related AAuM. A large sales team of 2,911 (Sep’25) also supports overall distribution. Hence, direct and banca share is higher than peers. Recent equity distribution mix was: banca at 19.3% (ICICIBC: 8.5%), ND-15.6%, MFD-37.5%, & direct at 27.6%.
* More diversified revenue; healthy AAuM/core PAT CAGR: ICICIAMC has a higher share of non-MF revenue. Alternates business consists of PMS, AIF and advisory with combined QAAuM of Rs729.3bn (Sep’25). Excluding PMS/AIF related expenses, contribution to revenue for FY25 is better than peers at 9.2%. Driven by market share gains, we expect higher equity AAuM CAGR of 22.7% in FY25-28E vs. 20% for industry. This should result in a core PAT CAGR of 18.5% over FY25-28E, which would be highest among listed peers.
Please refer disclaimer at https://www.plindia.com/disclaimer/
SEBI Registration No. INH000000271