Buy ICICI Prudential AMC Ltd for the Target Rs 3,850 by Motilal Oswal Financial Services Ltd

In-line revenue; negative other income leads to PAT miss
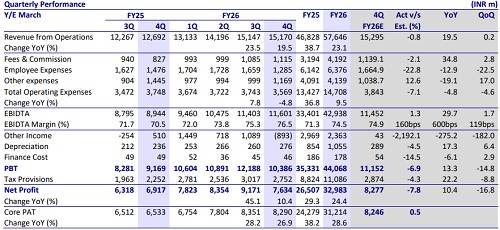
* ICICI Prudential AMC’s (IPRU) operating revenue grew 20% YoY (flat QoQ) to INR15.2b (in line) in 4QFY26. Yields came in at 55bp vs. 57.7bp in 4QFY25 and 56.3bp in 3QFY26. For FY26, revenue grew 23% YoY to INR57.6b.
* Total opex at INR3.6b was down 5% each YoY/QoQ, with employee costs down 13% YoY/23% QoQ and other expenses down 19% YoY/up 17% QoQ. EBIDTA came in at INR11.6b (in line), up 30% YoY/2% QoQ. Margins stood at 76.5% vs. 70.5% in 4QFY25 and 75.3% in 3QFY26. For FY26, EBITDA came in at INR42.9b, up 29% YoY.
* PAT stood at INR7.6b (8% miss due to negative other income), up 10% YoY but down 17% QoQ. PAT margins came in at 50.3% vs. 54.5% in 4QFY25 and 60.5% in 3QFY26. For FY26, PAT came in at ~INR33b, up 24% YoY.
* Overall gross yield stood at 52bp, with net yield at 48.3bp as of Mar’26; management indicated new TER regulations (effective Apr’26) may impact gross yields by 3-4bp (under negotiation). Net yields for AIF/PMS improved to 0.98% in 4QFY26 from 0.91% in 3QFY26, driven by product mix.
* We have maintained our earnings estimates for FY26, FY27 and FY28, factoring in relatively lower equity AUM growth, which is expected to be offset by incremental income and AUM inflows from SIF and ICICI Venture investments. Over FY26-FY28E, we project AUM/revenue/PAT CAGRs of 17%/15%/16%. We maintain our BUY rating on the stock, with a target price of INR3,850, based on 45x FY28E core EPS.
Market share across categories continues to expand
* Total MF QAAUM grew 26% YoY/3% QoQ to INR11t. Equity/Hybrid/ETFs/ Index/Debt/Liquid funds saw YoY growth of 5%/31%/61%/19%/14%/5%.
* The share of Equity/ETF/Debt/Liquid in the total QAUM stood at ~59%/ 13%/14%/10% in 4QFY26 vs. 58%/10%/15%/12% in 4QFY25.
* PMS AUM grew 26% YoY but declined 2% QoQ to INR268.3b due to MTM impact. Advisory assets fell 9% YoY to INR291.3b, while AIF AUM increased 47% YoY and 7% QoQ to INR170.3b. IPRU’s market share improved sequentially in 4QFY26 across segments – overall MF QAAUM/Active MF/MF Equity/Equity Hybrid to 13.5% (2nd highest)/ 13.7% (highest)/14.2% (highest)/26.7% (highest) from 13.3%/13.5%/13.8%/26.3% in 3QFY26.
* SIP flows trended upward during the quarter to INR51b compared to INR39.1b in 4QFY25 and INR50.4b in 3QFY26.
* On product launches, two SIFs were launched in Jan’26 with AUM of INR18.96b as of Mar’26. Additionally, an inbound fund (first offering in IFSC GIFT City) was introduced recently, with 4-5 NFOs under approval, of which ~two launches are expected in the near term (SIFs and equity oriented).
* On the distribution front, MFDs remained dominant in the equity AUM mix at 36.7%, followed by direct (28.9%), national distributors (15.5%), and banks (~18.9%) in 4QFY26 vs. 37.3%/28%/15.5%/19.2% in 3QFY26, respectively
* Unique customer base grew 5% QoQ to 17m as of Mar’26, driven by expansion in lower-tier and B30 cities.
* The total investment book stood at INR38.6b as of Mar’26, with 75.2% in MFs (62.8% equity, 36.7% liquid & debt, balance others), 20.9% in AIF/other equity/REITs, and the remainder in corporate bonds vs. 85.8% in MFs and 14.2% in AIF/other equity/REITs as of Dec’25.
* Operating expenses stood at INR3.6b, down 5% YoY/QoQ, with an opex-to-AUM ratio at 12.9bp vs. 17bp in 4QFY25 and 13.9bp in 3QFY26.
* Employee costs were INR1.3b, down 13% YoY/23% QoQ as the company changed its policy from rewarding employees with investments in IPRU AMC schemes to ESOPs. Excluding ESOPs, the cost run-rate is expected to remain stable.
* Non-cash ESOP cost is estimated at INR1.2-1.3b, to be amortized over FY27-29 (INR640-680m in FY27, INR360-380m in FY28, INR180-220m in FY29).
* Other expenses were INR1.2b, down 19% YoY but up 17% QoQ. ? Other income was negative at INR 893m in 4QFY26 vs. positive at INR510m in 4QFY25 and INR1.1b in 3QFY26, mainly due to the MTM impact.
Key takeaways from the management commentary
* New TER regulations, effective Apr’26, are expected to have a 3-4bp impact on a gross basis; negotiations are underway.
* The company remains focused on SIF products, having launched two in Jan’26 with more in the pipeline; yields are in line with equity products given the equity-oriented mix, and the segment is attracting largely new investors.
* It has completed the transfer of ICICI Venture fund management rights (no material considerations paid), with AUM inflows starting in Apr’26; ventures platform (INR46.2b AUM) spans PE, early-stage PE, and affordable real estate, with funds under deployment.
Valuation and view
* IPRUAMC is one of the top asset managers in India, backed by strong brand credibility and a diversified product and distribution mix, with continued strength across equity, hybrid, and passive segments alongside steady SIP and retail base expansion.
* While near-term equity net flows may be volatile, the company is wellpositioned structurally, supported by product diversification, strong investor stickiness, improving fund performance, and upcoming launches.
* We have maintained our earnings estimates for FY26, FY27 and FY28, factoring in relatively lower equity AUM growth, which is expected to be offset by incremental income and AUM inflows from SIF and ICICI Venture investments. Over FY26-FY28E, we project AUM/revenue/PAT CAGRs of 17%/15%/16%. We maintain our BUY rating on the stock, with a TP of INR3,850, based on 45x FY28E core EPS.
For More Motilal Oswal Securities Ltd Disclaimer
http://www.motilaloswal.com/MOSLdisclaimer/disclaimer.html
SEBI Registration number is INH000000412