Bulls & Bears September 2025 :India Valuations Handbook - Weakness persists; India underperforms global markets by Motilal Oswal Financial Services Ltd

Weakness persists; India underperforms global markets
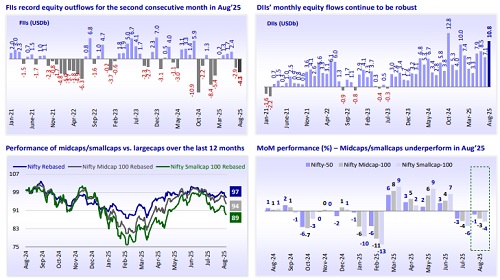
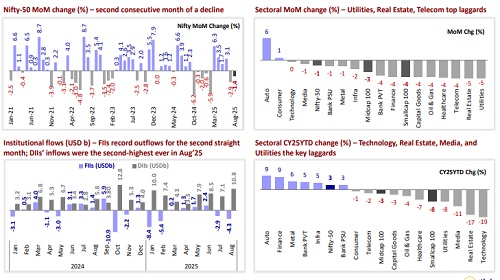
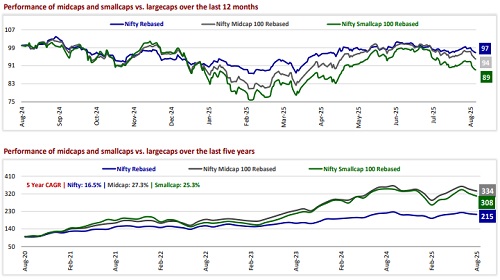
* Market corrects for the second consecutive month in Aug’25: The Nifty ended 1.4% lower MoM at 24,427 in Aug’25 – the second consecutive month of a decline. Notably, with extreme volatility, the index hovered around ~816 points before closing 342 points lower. The Nifty is still up 3.3% in CY25YTD. The Nifty Smallcap 100 (-4.1% MoM) and Nifty Midcap 100 (-2.9% MoM) underperformed the Nifty-50 during the month. Over the last 12 months, largecaps, midcaps, and smallcaps have declined 3.2%, 6%, and 10.8%, respectively. Over the last five years, midcaps (CAGR: 27.3%) have significantly outperformed largecaps (CAGR: 16.5%) by 119%, while smallcaps (CAGR: 25.3%) have markedly outperformed largecaps by 93%.
* DII inflows vs. FII outflows: In Aug’25, DIIs posted the second-highest ever inflows at USD10.8b after a record high in Oct’24. FIIs recorded the second consecutive month of outflows at USD4.3b. FII outflows from Indian equities reached USD15.3b in CY25YTD vs. outflows of USD0.8b in CY24. DII inflows into equities remained robust at USD59.4b in CY25YTD vs. USD62.9b in CY24.
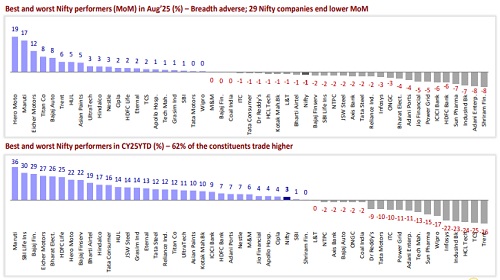
* All major sectors end lower in Aug’25: Among the sectors, Utilities (-5%), Real Estate (-5%), Telecom (-4%), Healthcare (-4%), and Oil & Gas (-4%) were the top laggards MoM, while Automobiles (+6%) and Consumer (+1%) were the only gainers. The breadth was adverse in Aug’25, with 29 Nifty stocks ending lower. Hero Motocorp (+19%), Maruti Suzuki (+17%), Eicher Motors (+12%), Titan (+8%), and Bajaj Auto (+8%) were the top performers, while Shriram Finance (-8%), Adani Enterprises (-8%), IndusInd Bank (-7%), Sun Pharma (-7%), and HDFC Bank (-6%) were the key laggards.
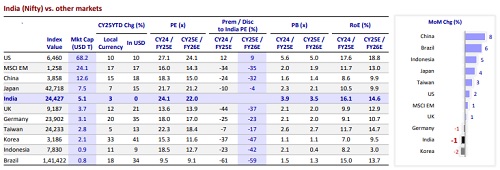
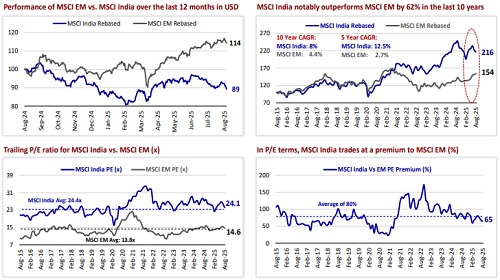
* India among the laggards in Aug’25: Among the key global markets, China (+8%), Brazil (+6%), Indonesia (+5%), Japan (+4%), Taiwan (+3%), the US (+2%), MSCI EM (+1%), and the UK (+1%) ended higher in local currency terms. However, Korea (-2%), India (-1%), and Germany (-1%) ended lower MoM in Aug’25. Over the last 12 months in USD terms, the MSCI India Index (-11%) underperformed the MSCI EM Index (+14%). Over the last 10 years, the MSCI India Index notably outperformed the MSCI EM Index by a robust 62%. In P/E terms, the MSCI India Index is trading at a 65% premium to the MSCI EM Index, below its historical average premium of 80%.
* Earnings review – 1QFY26: Modest yet Resilient!: Corporate earnings for 1QFY26, perceived as the “Crossover quarter,” marked a transition from the subdued low-single-digit earnings growth of FY25 to a sustainable double-digit growth trajectory. A key highlight of the quarter was better sectoral breadth of earnings growth. Of the 25 sectors under our coverage, 16 delivered double-digit growth, eight reported single-digit growth, and only one sector experienced a decline in PAT. The aggregate earnings of the MOFSL Universe companies grew 11% YoY (vs. our estimate of 9% YoY) in 1QFY26. For Nifty-50, PAT grew 8% YoY (vs. our estimate of +5%). Nifty reported a single-digit earnings growth for the fifth consecutive quarter since the pandemic (Jun’20; please refer to the detailed report).
* Our view: Indian markets have been lackluster over the past year (Nifty -3.2% YoY) and underperformed several global peers. This is primarily attributed to earnings weakness, compounded further by a series of geopolitical and macro headwinds. We believe that the influence of the US tariff wars on Indian markets will be limited. India’s real GDP growth surprised positively as it accelerated to 7.8% YoY in 1QFY26 (highest in five quarters), up from 6.5% in 1QFY25 and well above our expectations of 6.5%. The expansion was broad-based, with manufacturing, agriculture, and services all contributing meaningfully to the strong performance. The Nifty trades at 22x FY26E earnings, near its LPA of 20.7x. While our model portfolio bias remains towards largecaps (~70% weight), we have turned more constructive towards mid-caps (with 22% weight vs. 16% earlier) owing to better earnings delivery and improving prospects. We are OW on BFSI, Consumer Discretionary, Industrials, Healthcare & Telecom, while we are UW on Oil & Gas, Cement, Real Estate, and Metals.
* Top ideas: Largecaps – Bharti Airtel, ICICI Bank, Larsen & Toubro, Mahindra & Mahindra, Sun Pharma, Ultratech Cement, Titan Company, Eternal, Bharat Electronics, Tech Mahindra, TVS Motor, Lodha Developers, and Indian Hotels. Midcaps and Smallcaps – Dixon Technologies, SRF, Suzlon Energy, Jindal Stainless, Coforge, Supreme Industries, Page Industries, Kaynes Tech, Radico Khaitan, UTI AMC, and Niva Bupa Health.
DII inflows the second-highest ever in Aug’25, following a record high in Oct’24
Metals: Improving margin due to metal price recovery and muted costs
* The metals industry currently trades at 6.1x EV/EBITDA on a one-year forward basis, close to its long-term average of 6x EV/EBITDA. Sector valuations remain supported by healthy domestic demand and a stable pricing environment. However, the volatility in commodity prices due to global trade uncertainties and muted global demand continues to weigh on near-term multiples. These risks have capped further re-rating despite strong domestic fundamentals.
* The metals sector experienced a steep correction from 8.4x to 6x EV/EBITDA due to higher cheap imports, keeping pricing under pressure. China’s steel exports surged to ~111mt in CY24 (~25% of global exports), up from 53mt (~14% share) in CY20. We believe exports likely peaked in CY24, with volumes set to gradually decline over CY25-27E, led by widespread tariffs and anti-dumping actions globally.
* The Indian government imposed a 12% safeguard duty on flat steel to counter rising imports (reduced imports by >50% YoY as of Jun’25). Post-duty, domestic HRC prices recovered 12% to INR52,300/t (+5% premium to landed Chinese imports), and we believe the duty will help to sustain realizations. On the other hand, the non-ferrous prices continue to remain firm at elevated levels supported by the global demand-supply mismatch.
* India imports ~80% of its coking coal, making it highly exposed to global volatility. HCC Australia FOB ranged bound at USD180–190/t (India CNF ~USD195/t). With muted global demand and discounted Russian supply, the HCC prices should remain steady at current levels. Also, the cost of production for non-ferrous has reduced significantly, led by a rising share of captive coal and better availability of domestic coal.
* In FY25, domestic HRC spreads dipped to a decade-low of INR27,500/t (~USD320/t) as weak pricing was offset by muted input costs. Going forward, we expect steel prices to improve, aided by safeguard duties and lower imports. With iron ore/coking coal costs likely to remain stable, India’s spreads should expand to +USD350/t in FY26, implying margin recovery for steel producers will be the catalyst for valuation expansion.
Another harsh ride – Nifty down 1.4% MoM
* The Nifty ended 1.4% lower MoM at 24,427 in Aug’25 – the second consecutive month of a decline. Notably, with extreme volatility, the index hovered around ~816 points before closing 342 points lower. The Nifty is still up 3.3% in CY25YTD.
* All major sectors ended lower – Utilities (-5%), Real Estate (-5%), Telecom (-4%), Healthcare (-4%), and Oil & Gas (-4%) were the top laggards MoM, while Automobiles (+6%) and Consumer (+1%) were the only gainers.
Breadth adverse in Aug’25, with 29 Nifty stocks closing lower MoM
* Best and worst Nifty performers in Aug’25: Hero Motocorp (+19%), Maruti Suzuki (+17%), Eicher Motors (+12%), Titan (+8%), and Bajaj Auto (+8%) were the top performers, while Shriram Finance (-8%), Adani Enterprises (-8%), IndusInd Bank (-7%), Sun Pharma (-7%), and HDFC Bank (-6%) were the key laggards.
* Best and worst Nifty performers in CY25YTD: Maruti Suzuki (+36%), SBI Life Insurance (+30%), Bajaj Finance (+29%), Eicher Motors (+27%), and Bharat Electronics (+26%), have been the top performers, while Trent (-26%), TCS (-25%), HCL Tech (-24%), IndusInd Bank (-23%), and Infosys (-22%) have been the key laggards
Smallcaps underperform over the last 12 months
* Over the last 12 months, smallcaps declined 11%, underperforming largecaps and midcaps, which dipped 3% and 6%, respectively. Over the last five years, midcaps have significantly outperformed largecaps by 119%, while smallcaps have markedly outperformed largecaps by 93%.
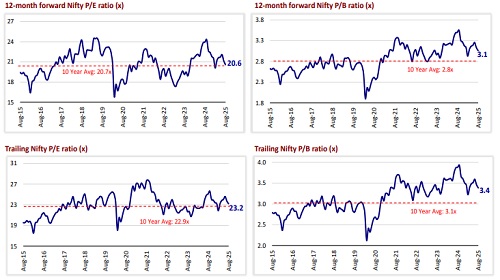
Nifty’s P/E at its historical average, while P/B above its average
* The Nifty is trading at a 12-month forward P/E ratio of 20.6x, near its LPA of 20.7x. In contrast, its P/B of 3.1x represents an 8% premium to its historical average of 2.8x.
* The 12-month trailing P/E for the Nifty, at 23.2x, is also near its LPA of 22.9x (at a 1% premium). At 3.4x, the 12-month trailing P/B ratio for the Nifty is above its historical average of 3.1x (at an 8% premium).
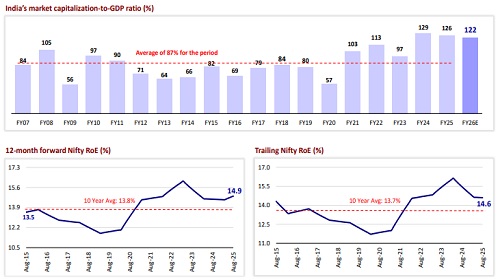
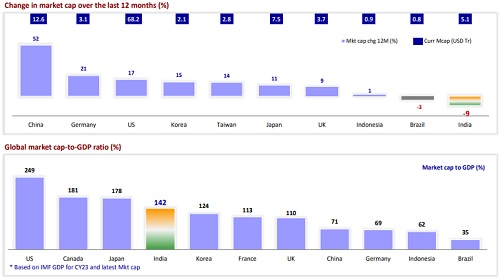
Market cap-to-GDP ratio at 122%, well above its long-term average
* India’s market cap-to-GDP ratio has been volatile, plummeting to 57% (of FY20 GDP) in Mar’20 from 80% in FY19 and then sharply rebounding to 132% in FY24 and 126% in FY25. It now stands at 122% of FY26E GDP (10.5% YoY), well above its long-term average of 87%.
* The Nifty is trading at a 12-month forward RoE of 14.9%, above its long-term average.
India among the laggards in Aug’25
* Among the key global markets, China (+8%), Brazil (+6%), Indonesia (+5%), Japan (+4%), Taiwan (+3%), the US (+2%), MSCI EM (+1%), the UK (+1%) ended higher in local currency terms. However, Korea (-2%), India (-1%), and Germany (-1%) ended lower MoM in Aug’25.
* Indian equities have been trading at 22x FY26E earnings. The key markets continued to trade at a discount to India.
MSCI India underperforms MSCI EM over the last 12 months
* Over the last 12 months in USD terms, the MSCI India Index (-11%) underperformed the MSCI EM Index (+14%). Over the last 10 years, the MSCI India Index notably outperformed the MSCI EM Index by a robust 62%.
* In P/E terms, the MSCI India Index is trading at a 65% premium to the MSCI EM Index, below its historical average premium of 80%.
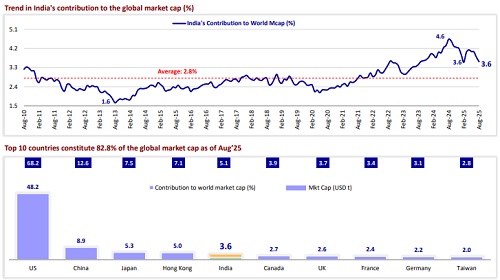
India’s share of global market cap moderates to 3.6%
* India’s share of the global market cap stood at 3.6% in Aug’25, close to its 16-month low of 3.6% reached in Feb’25.
* India is among the top 10 contributors to the global market cap. The top 10 contributors accounted for 82.8% of the global market cap as of Aug’25.
Key global markets experience an increase in market cap over the last 12 months
* Over the last 12 months, global market cap has risen 17.5% (USD21.1t), whereas India’s market cap declined 9.3%.
* Barring India and Brazil, all major key global markets have witnessed a rise in market cap over the last 12 months.
For More Research Reports : Click Here
For More Motilal Oswal Securities Ltd Disclaimer
http://www.motilaloswal.com/MOSLdisclaimer/disclaimer.html
SEBI Registration number is INH000000412


More News

India Strategy : Beyond the AI Rally: The Great Rotation by Motilal Oswal Financial Services...