MOSt Quantitative Outlook Monthly 2nd Jan 2026 by Motilal Oswal Wealth Management Ltd
Bank Nifty
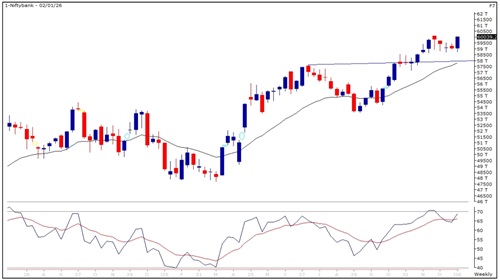
Bank Nifty crossed all barriers to touch a fresh all time high of 60114 zones with the PSU names continuing to tell a compelling story of resilience. On the monthly scale, the rate sensitive index formed a small bodied bearish candle with longer lower shadow. Price action suggests that a sustained hold above 59000 zones could open further upside move towards 61000 and then 61500 zones, while on the flip side, supports are placed at 58750 and then 58000 zones.
Nifty Auto Index
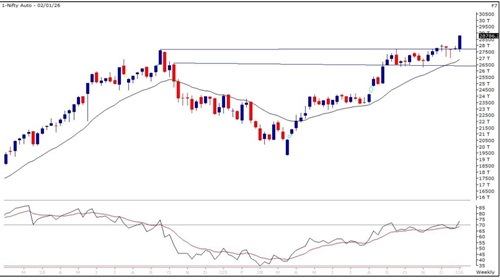
Nifty Auto Index has breached above its previous year’s swing high and is poised to head towards new all-time high zones post a four-month consolidation. The index has formed a strong bodied bullish candle on the weekly scale, indicating renewed buying interest. Momentum indicator RSI is rising, confirming positive momentum. Thus, based on the overall chart setup, we expect the sector to head towards 29850 and 30300 zones, while on the downside support is placed at 27500 and 26950 levels
Relative Rotation Graphs(RRG):
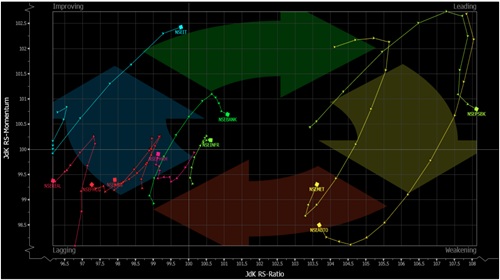
Relative rotation graphs chart shows the relative strength and momentum for group of Stocks/ Indices. It allows us to compare a security against the benchmark to see if it is outperforming or underperforming the benchmark. It is derived on Relative strength in which value of a sector is divided by the value of index mainly a benchmark which allows us to compare the performance of the sector. Relative Strength ratio is normalized to oscillate around 100 (plotted on X axis) i.e Jdk RS- Ratio along with this it provides the speed and direction of the Relative strength ratio (plotted on Y axis) i.e Jdk RS- momentum. The scatter plot is divided into four quadrants i.e Leading, Weakening quadrant, Lagging and Improving quadrant.
The analysis of sectorial RRG shows that Nifty Bank, Infra and PSU banks are in the leading quadrant which indicates strength going ahead. Nifty Auto is in weakening quadrant which suggests momentum is declining but strength is intact for buy on dips stance. Nifty Pharma, FMCG, Realty and Energy are inside the lagging quadrant which shows strength and momentum both are missing. Nifty IT is under the improving quadrant which suggests strength is still low but momentum will start improving.
Nifty PSU Bank Index
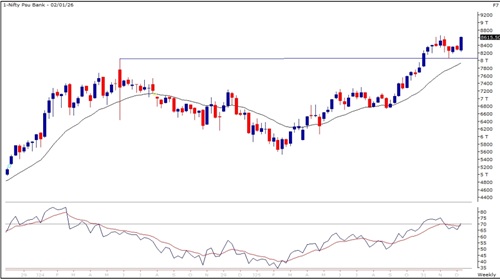
Nifty PSU Bank Index has retested its breakout zones on the weekly chart, suggesting a favorable entry point. The index has also taken support from its 50 DEMA and is inching higher. Momentum indicator MACD is indicating bullish momentum. Thus, based on the overall chart setup, we expect the sector to head towards 9000 and 9200 zones, while on the downside support is placed at 8300 and 8100 levels.
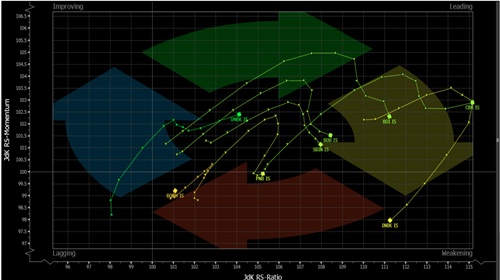
RRG For Nifty PSU Bank
The analysis of RRG for PSU banks shows that State bank of India, Canara bank, Bank of Baroda, Bank of India, are in the leading quadrant which indicates strength going ahead. Bank of Maharashtra and PNB are inside the lagging quadrant which shows strength and momentum both are missing.
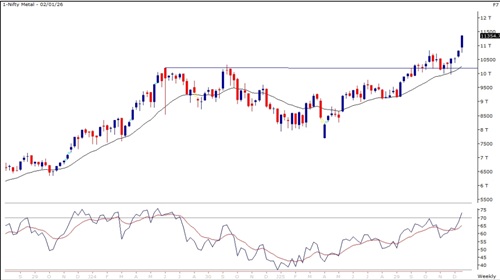
Nifty Metal Index
Nifty Metal Index is in an overall uptrend and is perfectly respecting its 20 WEMA with minor dips being bought into. The ADX line is rising and the positive DI is placed above the negative DI, suggesting strength in the ongoing bullish trend. Thus, based on the overall chart setup, we expect the sector to head towards 11750 and 12000 zones, while on the downside support is seen at 10850 and 10650 levels.
For More Research Reports : Click Here
For More Motilal Oswal Securities Ltd Disclaimer
http://www.motilaloswal.com/MOSLdisclaimer/disclaimer.html
SEBI Registration number is INH000000412


More News

Morning Market Outlook : : Nifty immediate support is at 23500 then 23400 zones while resist...