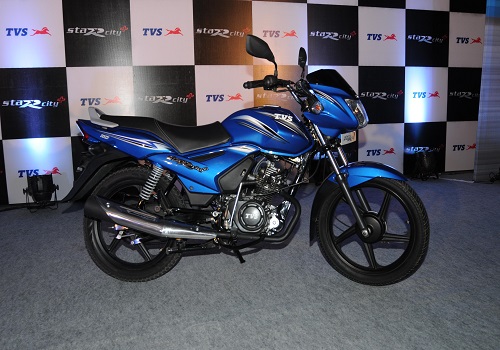
Add TVS Motor Ltd For Target Rs. 2,706 By Yes Securities
Margins resilient despite inflated operating exp.
Valuation and View – New launches on cards, Norton unveil by end FY26
TVSL 1QFY25 results were in line operationally as margins continues to be resilient at 11.5% (+90bp YoY/ +20bp QoQ). Gross margin expanded ~320bp YoY (+140bp QoQ) at 28.6% led by favorable mix and sustained cost controls. However, this was offset by higher staff and other expense due to increased variable cost linked to production (Rs600m) and brand/digital exp impact of Rs1.2b. Key operating metrics such as EBITDA/vehicle increased further to Rs8.8k/unit (+10.2% YoY/ +1.3% QoQ). The management indicated 2 new 2W launches each in ICE and EVs in 2QFY25 and EV 3W in FY25E. The management indicated rural/semi-urban markets are performing better vs urban (we have been indicating the trend since last 3-4 months in our channel check note). We continue to believe TVSL is better placed among 2W OEMs both in ICE and EVs led by better product acceptability which should drive further market share gains. However, we would remain watchful of the competitive launches in the 125cc segment and market share impact thereof. In our view, EBITDA margins expansion to continue given largely stable RM and price hikes. TVSL currently trades at 34.1x/29.1x of FY25/FY26 EPS (v/s HMCL/ BJAUT of 20- 24x on FY26 EPS). We believe, it should continue to trade at premium as we expect EPS CAGR of ~24.6% over FY24-27E. Sustained market share gains led by aggressive product pipeline, scope of external investments in to EV vertical are re-rating triggers. We reiterate TVS as our preferred pick among 2Ws with ADD with revised TP of Rs2,706 as we continue to value co at 30x Mar-27 EPS plus Rs124 value to TVS credit. Our FY25 is unchanged while FY26 EPS is upgraded by ~3% to factor in for cost controls.
Result Highlights – Steady as gains on GMs offset by higher other exp.
* Revenues grew 16% YoY (+2.5% QoQ) at ~Rs83.8b (est Rs84.8b) led by 14.1% YoY (+2.2% QoQ) growth in volumes at ~1.09m units while ASP grew 1.7% YoY (flat QoQ) at ~Rs77k/unit (est Rs78k/unit).
* Gross margins came in better at 28.6% (+140bp QoQ, est 26.9%) led by benign RM and favorable product mix. This was partially offset by higher other expenses at Rs9.6b (est Rs8.8b, +38% YoY/+9% QoQ) due to increase in variable payout due to higher production and brand/marketing spends. Hence, EBITDA grew 27.7% YoY (+3.7% QoQ) at Rs9.6b (est Rs9.5b) with margins at 11.5% (+90bp YoY/+20bp QoQ, est 11.2%).
* Led by lower depreciation at Rs1.76b (est Rs1.9b, -6.5% QoQ) due to write-off of slow moving products tools, Adj.PAT came in at ~Rs5.8b (+23.4% YoY/+18.9% QoQ, est Rs5.7b).
Please refer disclaimer at https://yesinvest.in/privacy_policy_disclaimers
SEBI Registration number is INZ000185632.

