Accumulate Nippon Life India Asset Management Ltd for Target Rs.1090 by Elara Capital

Strong beat, but near-term upside limited
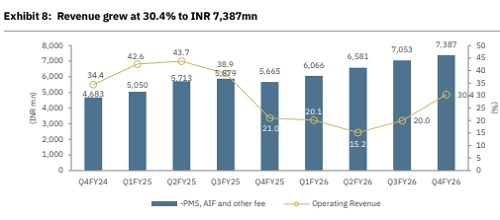
Nippon Life India Asset Management (NAM IN) reported QAAUM of INR 7,250bn (up 30.1% YoY / 3.4% QoQ). Overall market share rose to 8.9% (+63bps YoY / +24bps QoQ), while equity QAAUM market share stood at 7.2% (+24bps YoY). Equity constituted 45.5% of MF QAAUM, with ETF share rising to 33.4%. For FY26, the company delivered its annual PAT of INR 15,294mn (+19% YoY) and record operating profit of INR 17,949mn (+24.5% YoY). In Q4FY26, revenues grew 30% YoY / 5% QoQ to INR 7,387mn, ahead of our estimates of INR 7,023mn. Revenue yield improved sequentially to 35.8bps (34.6bps in QFY26). Total operating expenses grew by ~15.0%, as employee costs and other expenses both remained elevated, although employee costs were lower QoQ. Operating EBITDA stood at INR 5,071mn (up 38.9% YoY / 7.9% QoQ), ahead of our expectations (est.: INR 4,652mn), with an EBITDA margin of 68.6% versus 66.7% in the previous quarter. Other income came in at negative INR 335mn owing to market volatility. PAT came in at INR 3,847mn (up 28.8% YoY / down 4.7% QoQ), ahead of our expectations (est.: INR 3,733mn), while other income remained negative. Core PAT stood at INR 4,125mn, a strong beat vs. our estimates (est.: INR 3,393mn); core PAT yield stood at 20.0bps vs. 17.0bps in the previous quarter. Downgrade to Accumulate from Buy.
Strong ETF franchise set to perform well: NAM India's QAAUM has compounded at ~29.4% in the past three years, with revenues growing in tandem. NAM’s investor base is now at 23.8mn unique investors (38.8% market share). The ETF franchise remains a key differentiator, with QAAUM reaching INR 2,420bn (+57% YoY / +16% QoQ) and market share at 21.4% (+234bps YoY). Gold and silver ETFs combined AUM stood at INR 848bn, up 23% QoQ. The annualized systematic book of INR 447bn provides earnings visibility, while a nascent SIF business and expanding AIF commitments (INR 93.3bn, +26% YoY) offer additional longer-term growth vectors. However, the recent SEBI TER regulation poses a 3-4bps headwind on equity yields, which management intends to pass through to distributors. We are building in ~20% AUM CAGR and ~16.6% revenue CAGR, over FY26 to FY29E.
Key monitorables and emerging growth vectors: Key metrics to watch include trajectory of equity net sales market share (currently in high single digits, double-digit excluding NFOs), durability of revenue yield, and SIP book accretion. On the SIF front, while no formal product has been launched yet, back-end work on product structuring and back-testing is underway; management views SIF as a significant long-term opportunity, drawing parallels to where the ETF business stood a decade ago.
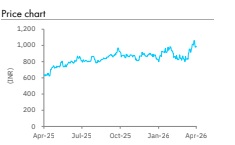
Downgrade to Accumulate; TP raised to INR 1,090: We downgrade NAM to Accumulate (from BUY), as the stock has meaningfully re-rated since our last upgrade, limiting near-term upside. The fundamental thesis remains intact — consistent market share gains, a resilient SIP book, and an expanding ETF franchise. We raise our TP to INR 1,090 (from INR 1,030) after rolling forward our valuation by a quarter. Our TP implies 35x Mar-28E core PAT. We marginally trim our FY27E revenue estimates by 1.8%, EBITDA estimates by 2.2% and core PAT estimates by 1.0%, primarily factoring in the SEBI TER regulation headwind of 3-4bps, while FY28E estimates remain broadly unchanged. We have introduced FY29E.
Please refer disclaimer at Report
SEBI Registration number is INH000000933