Accumulate ICICI Prudential Life Insurance Company Ltd for the Target Rs.725 by PL Capital
Growth picks up; structural improvement in margin
Quick Pointers:
* APE growth picking up led by surge in retail protection
* 9MFY26 Margin improves to 24.4% despite drag from GST exemption
While Q3 APE grew 3.5% YoY, company saw a strong surge in retail protection (+41% YoY) due to GST exemption. We expect the momentum to continue in Q4/ FY27E led by strong traction in retail protection, steady growth in NPAR and recovery in credit life. Q3 VNB margin improved to 24.4% driven by an increase in retail protection volume. Moreover, steady growth in NPAR, higher sum assured/ tenure and improved rider attachment helped offset the drag on profitability from GST exemption. We increase our FY26- FY28E VNB margin estimates by 20-50bps, factoring a sustainable improvement in margin profile. We use the appraisal value framework to value IPRU at a TP of Rs725 (1.9x FY27E P/EV). Upgrade to ACCUMULATE as valuation continues to be undemanding.
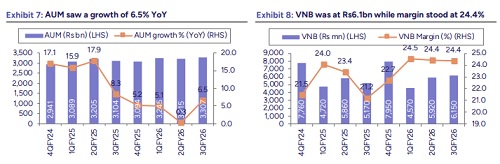
* Growth picking up led by retail protection: IPRU Life saw an APE growth of 3.5% YoY in 3QFY26 to Rs25.2bn driven by a strong growth in protection (+19% YoY). A surge in retail protection APE post GST exemption (+41% YoY) along with a recovery in credit life contributed to higher volumes in group protection (+6% YoY). While ULIP growth was lukewarm (+8% YoY), nonlinked portfolio grew 15% YoY, driven by new launches. Linked / Non-Linked / Annuity / Group / Protection comprised 52% / 18% / 6% / 6% / 18% of APE in 3QFY26. Company expects the momentum to continue in Q4, factoring in a benign base, pick-up in credit life and sustained demand in retail protection/ NPAR. While we build an APE growth of ~5% in FY26E, we expect it to pickup to 12%/ 13% in FY27/ FY28E respectively
* VNB margin seeing structural improvement: 3QFY26 VNB grew 19% YoY to Rs6.2bn. Q3 VNB margin rose to 24.4% (in-line with 9MFY26 VNB Margin) led by a surge in retail protection and cost optimisation measures. Company continues to engage with distributors on lower commissions and expects higher sum assured/ tenure and rider attachment to offset the drag on profitability from non-availability of ITC credit. We increase our FY26-FY28E VNB Margin estimates by 20-50bps to account for better-than-expected performance in 9MFY26 and long-term alignment in cost structures.
* 13M persistency trend to be monitored: 13M persistency saw a drop to 84.4% (vs. 85.3% in Sep-25) due to challenges in some channel and product pockets where persistency levels were lower than expected. AUM grew 6% YoY to Rs3,307.3bn and company re-raised sub-debt of Rs 12bn in Nov-25. Solvency ratio stood at 214.8%, sufficiently above the regulatory threshold of 150%.
* Partnership distribution drives growth; banca steady: Agency/ Direct/ Banca/ Partnership Distribution/ Group contributed 29%/15%/27%/14%/16% to overall APE in 3QFY26. While growth across proprietary channels (agency and direct) was largely flat YoY, partnership distribution grew 52% YoY led by retail protection. Banca grew 10% YoY with a stable run-rate for ICICIB (Rs ~1 bn per month). 9MFY26 Total Cost/ TWRP improved to 19.3% (vs. 19.8% in 9MFY25) and company highlighted positive operating leverage resulting in an improved margin profile.
Above views are of the author and not of the website kindly read disclaimer