The Bank Nifty opened the day on a positive note and traded within a range of 450 points throughout the day - ICICI Direct

Nifty :22082
Technical Outlook
Day that was
Indian equity benchmarks extended their losing streak for the tenth consecutive session, weighed down by global volatility and tariff-related uncertainty. The Nifty close at 22,082 down by 37 points. However, the market breadth remained in favor of advances, with an A/D ratio of 1.35:1. The midcap and small cap segments closed flat. Sector-wise, PSU Bank, Oil & Gas and Consumer Durable outperformed while, Auto, IT, FMCG were the laggards.
Technical Outlook:
* Nifty opened gap-down (22119-21974) and witnessed supportive efforts in the vicinity of long-term rising trendline, forming a higher high-low structure which helped in recovering most of the intraday decline. As a result, the daily price action formed a small green candle with a lower high-low, indicating supportive efforts from lower level.
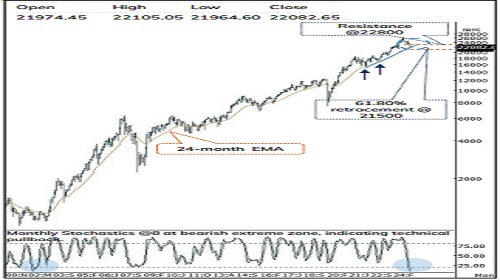
* Key point to highlight is that the ongoing correction from past five-month, index corrected 16%, and now has approached the long-term rising trendline (Adj Jun22 low and Mar23 low) amid oversold conditions. However, the index needs follow-through strength above the previous week’s high to confirm a pause in the correction. Given the oversold conditions, we believe investors should refrain from getting anxious at this juncture. The ongoing corrective move is expected to find its feet in the vicinity of key support threshold of 21800-21500 zone, while the earlier support of 22800 would now act as key resistance. Eventually, we expect the index to undergo base formation over the next couple of weeks based on following observations:
* A) The monthly stochastic oscillator is trading in the extreme oversold territory of 9 (lowest since 2002), indicating impending pullback.
* B) The market breadth has approached the bearish extreme as % of stocks (within Nifty 500 universe) above 50 and 200 days SMA has approached their bearish extreme of 7 and 10 respectively in current corrective phase. Historically, such bearish readings have paved the way for durable bottom in subsequent weeks.
* C) The US 10-year bond yields has corrected 7% last month and has formed bearish evening star candlestick pattern on the monthly chart, reinforcing the corrective bias.
* D) The US Dollar index has remained in the vicinity of 107 for the second consecutive month; any further weakness in the dollar would be supportive for emerging markets.
* E) Brent crude has snapped two months up move and sustaining well below $73 mark, which augurs well for the Indian economy and equity markets.
* F) Continued de-escalation of geopolitical tensions is expected to bring additional stability to the equity markets.
* On the broader market front, historical data from the past two decades suggest that in bull market phases, the Nifty midcap and small cap indices typically correct by 27% and 29%, respectively. In the current scenario, we believe both indices are approaching extremes of their bull market correction as Nifty midcap and small cap have already corrected 23% and 27%, respectively, Meanwhile, supportive effort from the decade long trendline in both midcap and small cap (Adj Jan 08 high and Oct 21 high) as per the rule of polarity where previous resistance now become support, reinforcing signs of accumulation, indicating limited downside ahead. Hence, the focus should be on accumulating quality stocks (backed by strong earnings) in a staggered manner.
* The formation of lower high-low signifies corrective bias wherein strong support is placed around 21500-22000 zone as it is confluence of:
* a) 61.80% retracement in the vicinity of 21500 of rally from (16828-26227)
* b) Rising trend line drawn adjoining subsequent major lows off Jun-22 of 15183 is placed at 22000.
* c) The 24-month EMA support is placed in the vicinity of 22000.
Nifty Bank : 48245
Technical Outlook
Day that was
The Bank Nifty witnessed a rangebound movement and concluded Tuesday’s volatile session on a positive note, up by 131 points . Meanwhile, the Nifty PSU Bank index outperformed the benchmark move and concluded the session on a positive note at 5719 , up by 1 .56 % .
Technical Outlook:
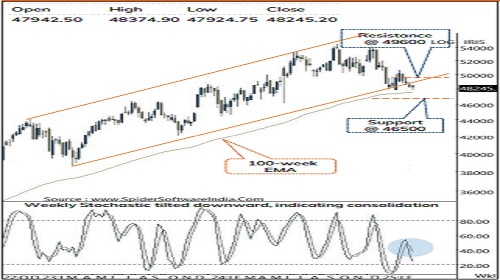
* The Bank Nifty opened the day on a positive note and traded within a range of 450 points throughout the day . The daily price action created sizeable bull candle near the lower end of broader range of 49600 -48700 , indicating supportive effort at lower level .
* Key point to highlight is that, the index defended the lower end of the broader consolidation range (48700 ) for the third time in past two months, triggering an intraday bounce . Going ahead, a follow through strength is required to reignite upward momentum, else consolidation phase may persist, while a decisive break on either side of the range would dictate the further course of action .
* Structurally, the Bank Nifty has shown resilience by holding above the previous swing low on a closing basis contrary to the Nifty index which is making lower high low . The index is consolidating in the vicinity of the lower band of 2 years rising channel, indicating relative strength . However, a follow through buying above previous weeks high (48972 ) would be required for a meaningful pullback to materialize which has been missing since past couple of weeks for the index to move towards the mark of 49600 , being previous swing high, coinciding with 52 - week EMA . On the other side, the near -term support is placed at 46500 mark which is in the vicinity of election days low .
* Mirroring the benchmark index, the Nifty PVT Bank index witnessed a lackluster session and traded within a tight range of 150 points . Structurally, the index is witnessing slower pace of retracement as over past three weeks it has retraced only 61 . 8 % of preceding 2 weeks up move (23508 -25025), indicating relative outperformance . Going ahead, a close above the previous day’s high will be the initial sign of the resumption in upward momentum, while a follow through buying will lead the index to resolve higher towards 25000 mark, being previous swing high . Meanwhile, immediate support is placed at 23500 , being the recent swing low .
Please refer disclaimer at https://secure.icicidirect.com/Content/StaticData/Disclaimer.html
SEBI Registration number INZ000183631