
Sell Silver Below 177500 SL ABOVE 178500 TGT 176400/175000 - Axis Securities Ltd

Macro
• Gold prices have recovered from the day's lows and are currently trading around the $3,900 level as investors await the US PPI data release. The yellow metal has remained under significant pressure over the past few days, as hotter-thanexpected CPI data has increased expectations of a rate hike in Dec’26. Additionally, hawkish commentary from Fed officials has pushed bond yields and the US Dollar Index higher, further weighing on gold prices. We expect gold prices to remain under pressure as long as they sustain below the $4,050 level.
• Nymex crude oil has been trading largely flat since morning, following a nearly 3% rally in the previous session, driven by short-covering. However, an increase in Saudi Arabia's production output, coupled with a rise in inventories, may act as a headwind for oil prices.
• Copper futures declined towards $6.20 per pound, approaching fresh four-month lows, as a stronger US dollar weighed on base metals amid growing expectations of tighter Federal Reserve policy following hotter-than-expected inflation data. Additionally, a rise in LME inventories to near five-month highs has further contributed to the sell-off in copper prices.
Panel One
* 15-minute candlesticks for a rolling three-day period have been plotted.
* Blue horizontal line shows an open gap which could either be up or down (open-gap up: low of next candle does not overlap the high of the prior candle, and vice versa for an open-gap down). The horizontal line showing the gap will only appear if the price has not visited the gap area.
Panel Two
* Plots the Slow Stochastics study to identify overbought (90 and above) and oversold (20 and below) areas.
* Signals are generated when the fast line (black) crosses the slow line (blue).
Panel Three
* Plots the Fisher Transform study that helps identify extremes and makes turning points clearer.
* Red bands lie between +2 and +3 and can be thought of as an area where a peak could occur. Green bands lie between -2 and -3 and often mark bottoms.
Gold
SELL GOLD BELOW 136400 SL ABOVE 136800 TGT 136000/135600.
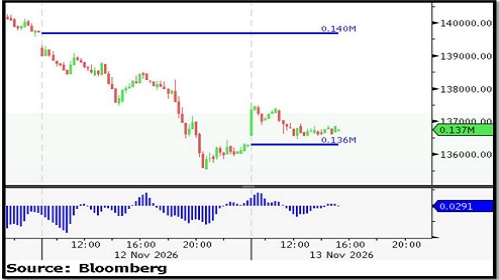
* Nearby Support: 1,36,400/ 1,36,000/ 1,35,600
* Nearby Resistance: 1,37,200/ 1,38,000/ 1,38,600
* Nearby Gaps: 136,000
Silver
SELL SILVER BELOW 177500 SL ABOVE 178500 TGT 176400/175000
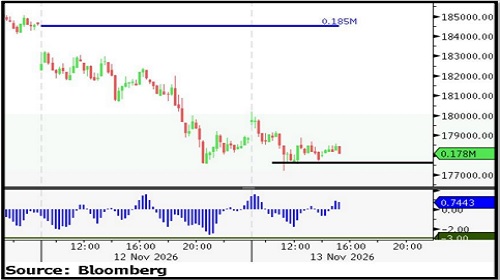
* Nearby Support: 1,77,500/ 1,76,000/ 1,75,000
* Nearby Resistance: 1,79,000/ 1,80,000/ 1,81,000
* Nearby Gaps: None
Crude Oil
BUY CRUDEOIL ABOVE 8400 SL BELOW 8300 TGT 8550/8700.
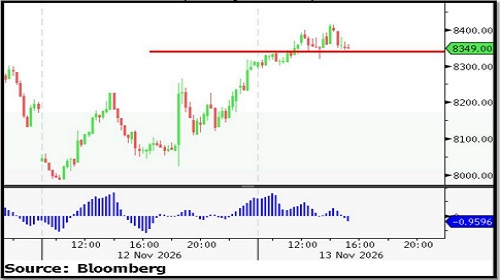
* Nearby Support: 8,300/ 8,200/ 8,050
* Nearby Resistance: 8,450/ 8,550/ 8,700
* Nearby Gap(s): None
Copper
SELL COPPER AROUND 1325 SL ABOVE 1332 TGT 1315/1305.
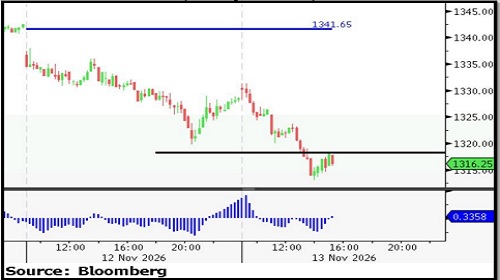
* Nearby Support: 1,310/ 1,300/ 1,290
* Nearby Resistance: 1,330/ 1,345/ 1,460
* Open Gap(s): 1341
For More Axis Securities Disclaimer https://simplehai.axisdirect.in/disclaimer-home
SEBI Registration number is INZ000161633