
Sell Copper Below 1343 SL ABOVE 1350 TGT 1333/1325 - Axis Securities Ltd

Macro
• Gold prices edged higher on Wednesday, recovering above the $4,040-an-ounce mark after a steep drop in the prior session. The rebound reflected cautious dip-buying as market participants weighed the likelihood of further Federal Reserve policy tightening against hotter-than-anticipated October inflation prints and hawkish signals from central bank policymakers.
• WTI crude oil advanced during Asian trading hours, staging a relief bounce from two-month lows as energy markets remained attuned to potential de-escalation developments in the U.S.–Iran conflict. The recovery came even as elevated October consumer inflation figures stoked worries over higher U.S. interest rates, with immediate geopolitical headlines continuing to steer price direction.
• Copper futures pushed toward $6.30 per pound, clawing back ground from four-month troughs. The red metal found firm underlying support from persistent physical supply tightness in China, the world's leading consumer, where domestic availability constraints continue to underpin spot demand.
Panel One
* 15-minute candlesticks for a rolling three-day period have been plotted.
* Blue horizontal line shows an open gap which could either be up or down (open-gap up: low of next candle does not overlap the high of the prior candle, and vice versa for an open-gap down). The horizontal line showing the gap will only appear if the price has not visited the gap area.
Panel Two
* Plots the Slow Stochastics study to identify overbought (90 and above) and oversold (20 and below) areas.
* Signals are generated when the fast line (black) crosses the slow line (blue).
Panel Three
* Plots the Fisher Transform study that helps identify extremes and makes turning points clearer.
* Red bands lie between +2 and +3 and can be thought of as an area where a peak could occur. Green bands lie between -2 and -3 and often mark bottoms.
Gold
SELL GOLD BELOW 141000 SL ABOVE 142000 TGT 139600/138800.
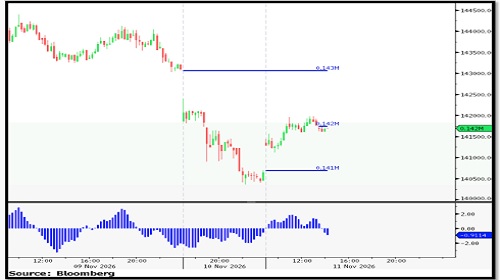
* Nearby Support: 1,41,000/ 1,39,000/ 1,37,300
* Nearby Resistance: 1,42,000/ 1,43,700/ 1,45,500
* Nearby Gaps: 1,42,000.
Silver
BUY SILVER ABOVE 188000 SL BELOW 184000 TGT 193000/196000.
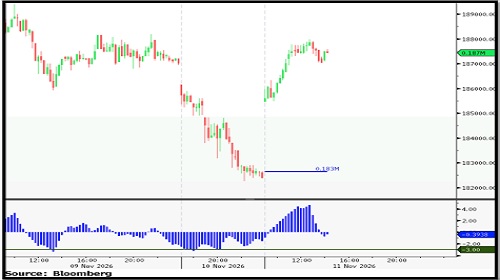
* Nearby Support: 1,85,000/ 1,81,000/ 1,77,000
* Nearby Resistance: 1,88,000/ 1,93,000/ 1,98,000
* Nearby Gaps: 1,83,000.
Crude Oil
SELL CRUDEOIL BELOW 8060 SL ABOVE 8150 TGT 7910/7830.
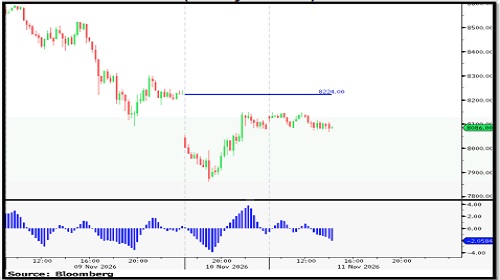
* Nearby Support: 8,060/ 7,900/ 7,760
* Nearby Resistance: 8,160/ 8,300/ 8,440
* Nearby Gap(s): 8,224.
Copper
SELL COPPER BELOW 1343 SL ABOVE 1350 TGT 1333/1325.
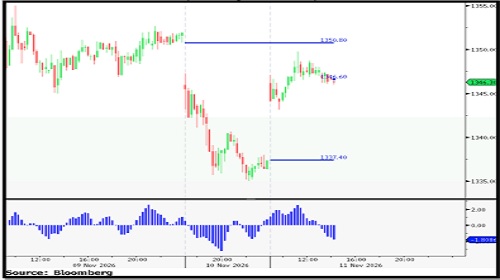
* Nearby Support: 1,343/ 1,332/ 1,323
* Nearby Resistance: 1,350/ 1,361/ 1,470
* Open Gap(s): 1,337.40.
For More Axis Securities Disclaimer https://simplehai.axisdirect.in/disclaimer-home
SEBI Registration number is INZ000161633