Report on Power Sector July 2025 - Merchant Power - Can It Handle Bouncy Cooling Demand ? by SBI Capital Markets
Power demand in Q1FY26 mellow in the shadow of early rains… cooling demand swing playing a large role
Energy supplied is down by 1.5% y/y in Q1FY26 – the first decline seen in Q1 since FY16 (barring COVID-19 impacted FY21). This is as 60% of the days in Q1FY26 saw above normal rainfall, dipping the mercury. Conversely, there were only 12 days in which both maximum temperature and humidity were above normal levels. These trends point towards the halo of cooling requirement on power demand, which is only set to grow in the future. Given the volatile nature of weather driven demand, this could pressure the financials of high-cost players in lean years, with them having to opportunistically play the merchant market during peak times to salvage their RoE
From energy demand to peak power demand to peak mismatch: evolving power exchange narrative tells a storage story
The highest price on exchange in recent times is no longer during the morning or evening peak, but late in the night, typically between 8 PM – 12 midnight, when the significant ramp down of solar supplies is met with increasing cooling demand. This creates a large mismatch, pushing spot prices towards the ceiling, even as average prices are drifting downwards. Our study of the RTM market shows that an average day in May’25 saw supply 10% below demand during this time of the day, with the worst-case scenario seeing 90% shortfall. Contrast this to the fact that supply is 2.8x demand during 7:00 AM – 5:00 PM (solar generation hours), the need for storage is amply clear to make best use of existing VRE capacities.
Capacity additions continue unabated, share of renewables in generation is expected to catch up in the next few years
Additions continue at an annualised pace of ~30 GW, of which a majority is solar. Utility solar addition pace is expected to saturate at current levels of 25-30 GW/year since the pace is sufficient to meet the target set, there is an increasing focus on load-oriented tenders (FDRE, RTC etc.) thereby reducing solar tender share to less than 50% in FY25, and ample non-utility capacity is coming up. On the generation front, heavy lifting is needed as share still remains in the low teens. Share of RE in generation will surge in coming years due to proliferation of higher CUF tracking bifacial modules, resurgence of wind which has higher CUF, and development of storage systems which will use excess solar supply effectively.
New VGF scheme indicates a coming-of-age, reducing incentive trajectory to not cause tariff upheaval as industry matures
Recognising these realities, the Union unveiled the next phase of its popular VGF scheme for standalone BESS projects. The contours of this 30 GWh scheme remain similar to the first tranche of 13 GWh, with the critical difference of incentive being capped at Rs. 1.8 mn/MWh (earlier lower of 30% of project cost or Rs. 2.7 mn/MWh). Significant tendering is left even in earlier phases, however, the reduction in VGF is expected to drive up tariffs by ~10%. Given the trajectory of battery prices, this may be comfortably absorbed within the next few months. We believe that incentives will gradually be withdrawn as capex costs reduce to maintain tariffs near current levels as these are competitive with alternates
Conclusion of key DISCOM schemes to impact credit growth of key FIs
The final piece of the jigsaw which has oft forced the industry to shake up the whole puzzle has always been T&D. Transmission additions need to accelerate significantly to enable renewable tie ups, and we are already seeing several RE projects stranded for lack of connectivity. Some are even exploring doing away with transmission dependence and developing localised grids with storage. On the distribution front, while aggregate statistics of DISCOMs remain middling, some progress has been made through RDSS and LIS/LPS which are reaching their sunset. Importantly, with RE lending not picking up fast enough to replace the significant DISCOM credit which was being extended in the past few years, major FIs could see slower growth in the medium term. With various moving parts, the funding ecosystem remains vibrant to support the rapid growth of the sector.
EARLY MONSOON DAMPENS POWER DEMAND IN Q1
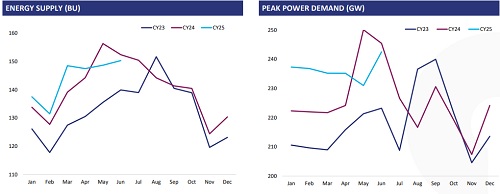
* Energy supplied is down by 1.5% y/y in Q1FY26 – the first decline seen in Q1 since FY16 (barring COVID-19 impacted FY21). This comes after FY25 saw moderate growth in energy supply despite having a bright Q1
* Notably, annual peak demand, which had occurred in May’25 in CY24 did not occur this time. Jun’25 saw select days in which rainfall was less seeing high peak demand, notably touching 241 GW
COOLING DEMAND BECOMING THE KEY VARIABLE IN PEAK DEMAND
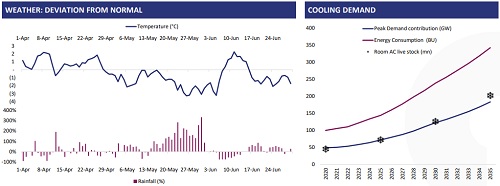
* 60% of the days in Q1FY26 saw above normal rainfall. Conversely, there were only 12 days in which both max. temperature and humidity were above normal. This reflects the power of cooling demand, and with AC ownership in India mirroring the rise seen in China some decades earlier, room ACs could contribute to nearly 25-30% of the total peak demand by 2035
* Importantly, unlike C&I demand which is predictable, changes in weather can impact cooling demand greatly. This means that volatility in power demand is set to increase in the future. This will pose a challenge to both GENCOS and DISCOMS in accurately forecasting the same and ensuring projects remain viable through lean periods
Above views are of the author and not of the website kindly read disclaimer


More News
Renewable Equipments Sector Update : MNRE extends ALMM List-II exemption till Dec'26 by Prab...