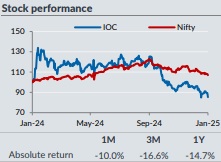
Reduce Indian Oil Corporation Ltd For Target Rs. 119 By Yes Securities Ltd
Strong core refining performance but inventory losses and weak marketing performance drags profitability
Indian Oil Corp Q3FY25 performance showcased performance which was impacted by inventory and adventitious losses. The integrated core margins in USD/bbl were at 5.2 versus our estimated 5.7. The reported EBITDA was at Rs71.2bn and Adj. PAT Rs 21.9bn, the core GRMs has been quite strong but was impacted by inventory losses, while the marketing performance stood weaker than our expectations with adventitious losses. Reported EBITDA and PAT is lower than our and consensus expectations. We downgrade the stock to a REDUCE rating with a revised target price of Rs119 (earlier Neutral, Rs154).
Result Highlights
* EBITDA at Rs71.2bn and Adj. PAT of Rs21.9bn; on improving core GRMs but was impacted by a significant inventory loss, while the marketing performance was impacted by a LPG subsidy burden of Rs 54.5bn with possible adventitious marketing losses. There was an exceptional item of Rs6.8bn this quarter stems from IOCL's reversal of a previously created provision, following a favorable Supreme Court ruling on VAT Input Tax Credit.
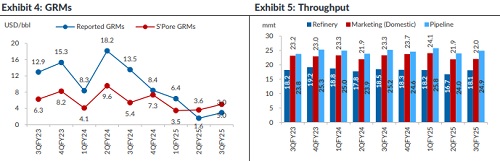
* The reported GRM was ~USD2.95/bbl (USD1.6 the previous quarter, USD13.5 a year ago), while the Arab heavy-light difference was USD1.9/bbl (1.3 in the quarter prior). The core GRM at USD6.6/bbl, (USD3.1 the prior quarter, USD10 a year ago), was at a premium of USD1.6/bbl over the benchmark which was at USD5/bbl. The refining inventory loss at USD3.7/bbl (a loss of USD1.5 the previous quarter, and a gain of USD3.5 a year back). Refinery throughput was 18.1mmt at 102% utilisation (95% the previous quarter, 104% a year ago).
* The integrated core EBITDA margins was USD5.2/bbl (USD2.6 the prior quarter, USD5.3 a year ago) marginally lower our estimated USD5.7/bbl.
* The core marketing EBITDA (back-calculated) was Rs2.8/ltr (Rs1.6 the prior quarter, Rs1.5 a year back). The domestic marketing throughput was 23.4mmt, down by 5% YoY but up 1.8% QoQ (vs. the industry’s growth of 4.8% YoY and 7.9% QoQ). MS sales were 3.97mmt, up 7.6% YoY and 2.9% QoQ, while diesel at 9.57mmt, flat YoY and 19.6% QoQ. Industry motor spirit and diesel sales were up 9.7%/4.8% YoY and 3.5%/18.9% QoQ. The company has a negative LPG subsidy buffer amounting to Rs 54.5bn as of Q3FY25 (Rs 143.23n for 9MFY25) pertaining to LPG subsidy. Product market share: The sales market shares of high-speed diesel and motor spirits both were marginally higher at 40.1% and 39.1%.
* Petchem EBIT loss at Rs 1.55bn vs a loss of Rs0.92bn the prior quarter, loss of Rs 1.96bn a year back. The sequential decline was due to weaker spreads.
* Capex was at Rs95.2bn (Rs 280bn for 9MFY25) and FY25 target of Rs 358bn. Debt of Rs1,315bn was up Rs253bn YoY but down by Rs112.5bn QoQ. The Rs 20.5bn forex loss impacted the quarterly profitability.
* 9MFY25 performance: EBITDA at Rs 195.2bn (vs Rs 598.7bn in 9MFY24) while Adj. PAT at Rs 38.6bn (vs Rs 347.8bn) and the reported GRM at USD3.7/bbl (vs USD13.3). The core GRM stood at USD4.2/bbl (vs USD11.7). The core integrated margins were at USD3.2/bbl vs USD7.2/bbl while the marketing EBITDA/ltr (Rs) was at 1.9 vs 2.4 in 9MFY24.
Valuation
IOCL has a Rs26.2bn/Rs38.5bn sensitivity to a change of Rs0.5/ltr/USD1/bbl, respectively. At CMP, stock trades at 10.7x/7.6x/8x FY25e/26e/27e EV/EBITDA and 1x/0.9x/0.9x P/BV (excl. investments, it trades at 9.5x/6.7x/7.1x FY25e/26e EV/EBITDA and 0.8x/0.7x /0.7x P/BV). We downgrade the stock to a REDUCE rating with a revised target price of Rs119 (earlier Neutral, Rs 154) valuing it on a sum-ofparts basis (core business at 7x EV/EBITDA and investments at Rs23).
Please refer disclaimer at https://yesinvest.in/privacy_policy_disclaimers
SEBI Registration number is INZ000185632