Nifty Recovers on Support, Forms Bullish Candle - ICICI Direct Ltd

Nifty : 24056
Technical Outlook
Day that was ..
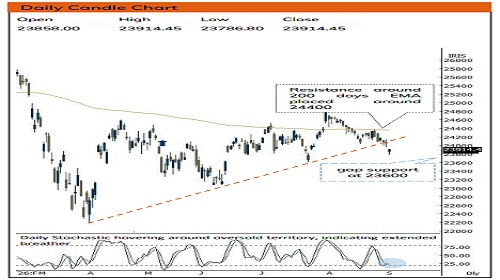
Equity benchmark extended losses over third session in a row tracking uncertainty around geopolitical concerns. Nifty settled the Wednesday’s session at 23914, down 0.6% (141 points). Market breadth relatively performed well as Nifty midcap and smallcap lost 0.5% and 0.4%, respectively. Sectorally, Oil & Gas and realty defied the benchmark move and settled with gains of 0.3% and 0.2% while Auto, IT remained laggard, down >1%
Technical Outlook :
• Index started the session on a subdued note. However, supportive efforts from 80% retracement level helped index to recover some of the losses. Daily price action resulted in a small bull candle with long lower shadow, indicating supportive efforts from key support zone.
• The index continued to drift lower and continues to trade below its cluster of moving averages. However, the main traction remained in the broader market space which endured with its resilience. Over past five weeks, Nifty midcap and smallcap index have corrected 3% and 2% respectively, compared to Nifty which has corrected ~4%. Further, with recent correction Nifty has been sustaining below its cluster of short-, medium- and long-term averages while in contrast midcap and smallcap indices respecting upward sloping 50- and 20-days EMA, that further affirm market strength. Therefore, focus should be on the broader market while Nifty witness subdued traction. Going ahead, Key support is placed at 23600 being July Low while to pause the ongoing corrective move a decisive close above previous session’s gap area (23952- 23914) would be the prerequisite.
• Structurally, it is important to highlight that the index has formed sequential higher bottoms off April low (22182). Each higher base has formed a peculiar pattern of arresting intermediate correction around 61.8% to 80% retracement of prevailing uptrend. The current ~990 points pullback precisely align with the structural rhythm, retracing 80% of Jul-Aug 1150 points rally. We expect index to maintain the same rhythm and form a higher base in coming weeks.
• Past two decades of historical data suggest that September has been the volatile month. However, such volatility has paved the way for direction move in subsequent months
• Smallcap index has logged an impressive ~35% rally off April low and reclaimed its all time high after 18 months. The historical data suggest that this is the initial leg of multi-year secular bull run rather than an overextended technical move. We believe that current up move has laid the foundation for a secular up move Our bullish outlook on the broader market is anchored by following key observations:
• A) Major corrections of ~35% or more have historically marked the beginning of a fresh market up-leg rather than the end of the broader bull cycle
• B)Post such correction, uptrends have sustained for subsequent ~20–22 months on average, with significant rally in subsequent year
• C)With current rally (~35%) only five months of its expansion, history suggest that we are just starting the secular up move, where the largest gains are yet to unfold
• Mirroring the historical rhythm off March peak of $120, Brent crude once again retreated from its 80% retracement of prevailing decline and now trading around $88. Falling crude oil would fuel the momentum in the Indian equities
Intraday Rational :
• Trend – Supportive efforts emerged from 80% retracement of last up move
• Levels – Buy around 80% retracement of last 2 days range
Nifty Bank : 57172
Technical Outlook
Day that was :
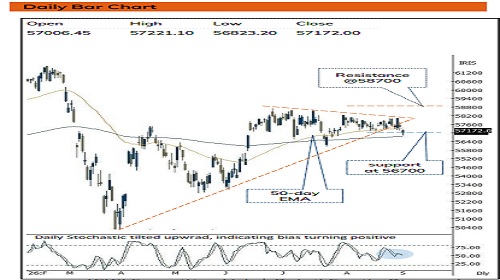
Bank Nifty ended the day on negative note down 0.4% at 57172 on back of mixed global cues.
Technical Outlook :
• The Index started the day with gap-down opening and thereafter found supportive efforts in vicinity of 200- day EMA. As a result, the daily price action formed small bull candle with lower shadow indicating buying demand from lower levels.
• Despite the deep intraday decline, the index managed to hold above 200-day EMA and index remains broadly defined between 56800 and 58000. Crucially, the index is hovering near its major long-term moving average support. Holding 56700 will keep pullback options open towards 58000 levels on the higher side.
• In the process, strong support is placed around 56700 being the placement of four months rising trendline coincided with 200 days EMA .
• The PSU Bank Index also formed small bull candle signaling buying from key moving average. Going ahead, follow through strength above last week high (8760) would open the door for next leg of up move towards 9100 levels
Intraday Rational :
• Trend - Prolongation of consolidation above 200 days EMA, indicating positive bias
• Levels : Buy around Wednesday close.
Please refer disclaimer at https://secure.icicidirect.com/Content/StaticData/Disclaimer.html
SEBI Registration number INZ000183631