Nifty Opens Bullish Gap, Forms Higher High-Low, Absorbs Dips - ICICI Direct

Nifty :23190
Technical Outlook
Day that was…
Indian equity benchmarks closed the expiry session on a positive note amid dovish comment by Fed chair and settled at 23190, up 1.24%. The market breadth was in favor of advance, with an A/D ratio of 1.50:1. Sector-wise, all sectors closed in green where, Oil & Gas, Auto and FMCG dominated.
Technical Outlook
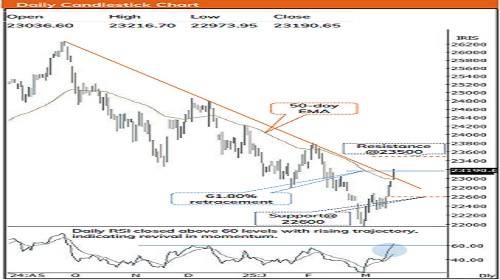
* The Nifty kicked off with a bullish gap, (22907-223036) after an initial dip, formed a higher high-low structure, with intraday declines being absorbed. As a result, the daily price action formed a strong bull candle, indicating positive bias. From last three session up move was supported by significantly above-average volumes, and today’s daily trading volumes surged from the usual sub-88k crores to over 1 lac crores, signals the continuation of positive momentum in the broader market.
* The follow through strength backed by across sector participation has helped Nifty to reclaim 23000 mark after one month. Consequently, index logged a breakout from six months falling trendline, and closed above 61.80% retracement of the recent fall (23807-21965), thereby reaffirming its resilience. The continuation of revival in momentum strengthens our confidence that the index has now paved the way towards 23400-23500 zone, which coincides with the 200-day EMA. In addition to that, RSI has closed above 60 for the first time since mid- Dec, signaling a revival in momentum. However, traders should note that past after >850 points up move seen over past four sessions couple of days breather can not be ruled out amid tariff-related developments. However, any corrective move from current levels can be used as a buying opportunity, as long as 22600 is protected. Meanwhile, focus should be on accumulating quality stocks from a medium-term perspective.
* Structurally, after the fall of 16% in last five months the sentiment and momentum indicator bounced from the bearish extreme levels where, % of stocks above 50-day SMA bounced from 7 to 41 level in Thursday’s session suggesting strength of the pullback. Meanwhile, past three decades data suggest that, the average drawdown below the 52-week EMA has been 6-7%, and in tandem with that even in current scenario index staged a recovery from same reading of 6% and reached in the vicinity of 52-week EMA in Thursday’s session. Considering aforementioned evidences, we believe that the index is approaching pricewise maturity with limited downside and would set the stage for next leg of up move. Our constructive bias is validated by following observations:
* a. The ratio chart of Nifty/Dow Jones has recorded a breakout from a six-month falling channel, indicating the domestic market could relatively outperform US equities going forward.
* b. The cool off in US 10-year Yields, Dollar Index and Brent crude augurs well for emerging markets by easing inflation and boosting sentiment.
* On the broader market front, the Midcap and Small cap indices closed above its 20-day EMA, and continuation after the break out from falling trendline, indicating inherent strength, suggesting extended pullback. Hence, the focus should be on accumulating quality stocks (backed by strong earnings) in a staggered manner.
* After Thursday’s breakout from the 50-day EMA and falling trendline this technical development made us revise the support levels around 22600 level which is 50% of the current upmove (21965-23216).
Nifty Bank : 50062
Technical Outlook
Day that was :
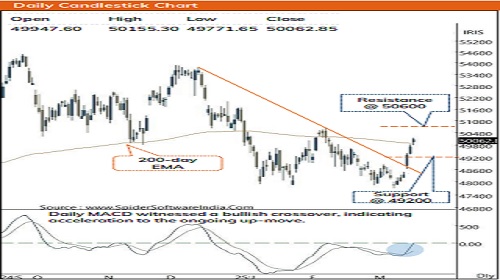
The Bank Nifty settled Thursday’s session on a positive note marking its sixth straight session in green where it closed the day at 50062 , up by 0 .72 % . The Nifty PVT Bank index mirrored the benchmark move and settled at 24913 , up by 0 .61 % .
Technical Outlook :
* The Bank Nifty maintained its upward trajectory and extended the positive momentum from the previous sessions where the price action resulted in a small bull candle, indicating continuation to the ongoing upward momentum .
* Key point to highlight is that, the index maintained its higher high low formation and witnessed a positive close above 200 DEMA, which was not the case since Dec -24 . Additionally, the index closed above the psychological mark of 50000 indicating that the bullish momentum is likely to continue and we expect the index to surge further towards 50600 being the previous swing high . Meanwhile, near -term support is placed at 49200 being 38 . 2 % retracement of the recent up -move (47702 -50155 ) . Going ahead, any pullback hereon should be capitalized as a buying opportunity and the focus should be on accumulating quality stocks from a medium -term perspective .
* Structurally, with 12 % correction from the top the index reached at the vicinity of 100 -week EMA, where it tested the mark of 47800 for four times is past two months and managed to sustain above it on a closing basis, thereby displaying the importance of the same . Given the recent falling trendline breakout and sustenance above 200 –day EMA, the outlook remains positive for further upside towards 50600 .
* In tandem with the benchmark index, the Nifty PVT Bank index witnessed a faster pace of up -move where it regained previous five weeks losses in just one week . Additionally, the index observed a breakout to the falling channel along with 200 -day EMA and witnessed a higher high low formation, indicating structural improvement . Going ahead, we expect the index continue the upward momentum and move towards 25400 being 50 % retracement of the previous fall (27280 - 23508 ) . On the downside the mark of 50 -day EMA which is around 24450 will provide immediate support .
Please refer disclaimer at https://secure.icicidirect.com/Content/StaticData/Disclaimer.html
SEBI Registration number INZ000183631


.jpg)