Nifty gaps up on oversold bounce, faces selling near 23000 EMA - ICICI Direct

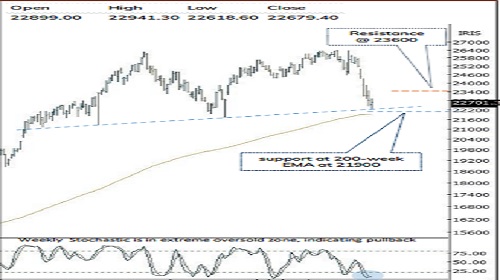
Nifty :22679
The Indian equity benchmark witnessed sharp reversal tracking positive global cues and cool-off in crude oil prices. Nifty settle the day at 22679 up ~348 points. Market breadth turned extreme positive with an A/D ratio of 10:1. The broader market relatively outperformed the benchmark with Mid and Smallcap segment gaining ~2.% and 3% each. Sectorally, barring Pharma and Healthcare all major indices closed in positive wherein BFSI and Metals were the top gainers.
Technical Outlook:
* The index opened the day with a positive gap-up amid oversold condition, however witnessed profit booking around the 10-day EMA (23000). As a result, price action has resulted in bear candle with higher-high-low structure in daily time frame, indicating selling pressure around key moving average.
* Index is likely to open Gap-down on back of geopolitical cues and rise in Brent crude prices. It is important to note that, onset of Iran-US/Israel conflict the index have made multiple attempts, but failed to build the momentum. Hence, a decisive close and sustain above previous session high which coincides with 10-day EMA (23000) would be required for a n extended pullback towards 23600. Else, continuation of corrective bias wherein key support is placed at 21900-21700
* In current scenario, Nifty has already corrected ~16% from life time highs that hauled most of the momentum, sentiment, breadth indicators in bearish extremes. Looking at the historical evidences we believe, current decline should find its feet around 21900-21700 zone. Our constructive bias is based on following observations:
a) Historically, since 1996, there have been only 4 occasions where index has given a monthly negative close for 4-5 months in a row, post which index has staged a gradual recovery. Currently, index corrected over 4 consecutive months
b) Meanwhile, such intermediate correction got arrested in the vicinity of long term 200 weeks EMA (barring 2001,2008, 2020), currently placed at 21930
c) Over past 25 years, there have been 8 occasions where bull market correction got arrested within 15-20% range with an average correction of 17%.
d) With the 16% decline (off Feb high of 26341), Nifty has hauled monthly stochastic oscillator in oversold territory (placed at 10)
e) Time Wise, since 2014, Indian equities have witnessed 3 major corrective phases, each lasting an average of ~20 months. The current correction, completed 18 months
f) On the Bank Nifty front, since Covid there have been six major correction which anchored around 20-22%. With 19% correction already in place with oversold conditions in place, indicating that the downside may be approaching maturity, in line with historical corrective cycles.
g) In case of geopolitical events, past four decades data suggest that price wise median correction matures around 11%. Buying during such a panic scenario has garnered >25% returns in next 6 months.
h) Whenever 85% of Nifty 500 universe trades below their 50 and 200 SMA and Net of daily advance-decline suggest that only 30 stocks are in positive territory, signals capitulated extremes. Post these extremes, the index has delivered a median rally of ~23% in the subsequent 6-12 months period. Historically, these oversold conditions have offered optimal entry points for constructing medium-to-long-term portfolios.
Intraday Rational:
* Trend – Stiff resistance from 10-day EMA, indicating selling pressure at key average
* Levels - Sell around 61.8% retracement of current down move.
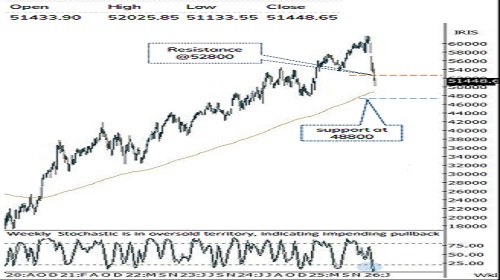
Nifty Bank :51448
The Index ended the day up 2.3% higher at 51,448 amid positive global cues. The Nifty PSU Bank Index relatively outperformed gaining 3.7%.
Technical Outlook:
* The price action has resulted into Doji like candle with higher highlower low structure on daily time-frame, indicating volatility at higher levels.
* Index is likely to open Gap-down on back of geopolitical cues and rise in Brent crude prices. Key highlight is that since onset of IranUS/Israel conflict the index have made multiple pullback attempts, but failed to build the momentum above its short-term moving (10- day EMA) placed at 52800. Going ahead, for a meaningful pullback to materialize Index needs to close and sustain above short-term moving average (52800) that would further extend pullback towards 54200 being recent swing high and 61.8% retracement of recent decline from (57097-50105). Meanwhile, strong support is placed at 48800 (being the 200-week EMA).
* Structurally, since Covid 2020, Index has undergone two major corrective phases of approximately 20% each, both followed by a gradual recovery over the subsequent quarter. In the current scenario, the index has already corrected ~19% from its peak, indicating that the downside may be approaching maturity, in line with historical corrective cycles.
* Further on the weekly timeframe, the stochastic oscillator has witnessed a bullish crossover from the oversold territory is at 9 levels, indicating positive momentum from deeply oversold conditions, with scope for a gradual pullback ahead. Therefore, on should avoid creating aggressive short position at current juncture , as technical pullback from current levels cannot be ruled out.
* On the broader space, the Nifty PSU Bank has formed high wave like candle at 200-day EMA indicating volatility on both the sides. Next key support is placed around 7400 being 80% Retracement of Sep-Feb 26 rally (6800-9918).
Intraday Rational:
* Trend- Lack of sustained follow through strength above shortterm moving average signifies near term weakness
* Levels- Sell around 80% retracement of yesterday range.
Please refer disclaimer at https://secure.icicidirect.com/Content/StaticData/Disclaimer.html
SEBI Registration number INZ000183631


.jpg)