Nifty Gaps Down Amid Weak Global Cues, Bearish Bias Persists - ICICI Direct

Nifty :22553
Technical Outlook
Day that was…
Indian equity benchmarks extended losses over fifth consecutive day tracking weak global cue and settled on a negative note at 22553 , down by 1%. The market breadth remained in favor of declines with the A/D ratio of 1:3. The broader market underperformed, where both the Nifty midcap index and the Nifty small cap index closed negative, down by around 1% respectively. Sectorally, FMCG, Auto and Pharma outperformed while IT, Metal and Oil & Gas were the laggard.
Technical Outlook:
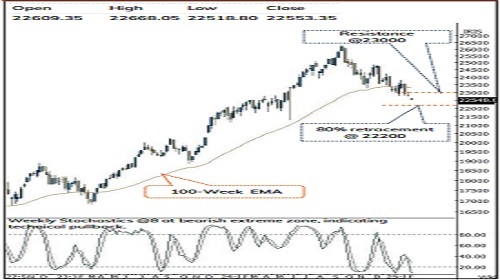
* Nifty witnessed gap down opening (22796-22609) tracking weak global cues, making lower low-high on an intraday basis where intraday pullbacks were short lived, resulting in a bear candle indicating continuation of corrective bias. Key point to highlight is that, the Nifty has formed a new low whereas midcap and small cap index has not breached the recent low, highlighting divergence in broader market
* The key point to highlight is that, after eight days of contracting range index has given a breakdown providing directional move on the downside. The formation of lower high-low clearly indicates prolongation of corrective bias wherein strong support is place at 22200 being 80% retracement of (21137-26277) which remains important level to watch out for in upcoming truncated monthly expiry week. Meanwhile, to pause the ongoing corrective phase, a decisive close above the previous day’s high would be required. Further, for a meaningful pullback to materialize index need to decisively close above 23000 mark.
* On the broader market front is that, past two decades data suggest, in a bull market phase, Nifty midcap and small cap have a seen average correction of 27% and 29%, respectively. In current scenario, we believe both indices are approaching extremes of their bull market correction as Nifty midcap and small cap have already corrected 20% and 24%, respectively, indicating limited downside going ahead. Hence, focus should be on accumulating quality stocks (backed by strong earnings) in a staggered manner.
* In the current corrective phase, where there is lot of pessimism in the market, we are witnessing some silver linings which would provide impetus for pullback rally in coming weeks, details listed below:
* a) Breadth Indicator: The market breadth has approached the bearish extreme as % of stocks (within Nifty 500 universe) above 50 and 200 days SMA has approached their bearish extreme of 13 and 5 respectively during last week. Historically, such bearish readings have paved the way for durable bottom in subsequent weeks.
* b) Momentum indicator: Past two decades data suggest that, the weekly RSI below 30 suggest oversold condition for the Nifty midcap and small cap indices. Which have been tested only on six occasions, resulting into 20% up move in subsequent three months, wherein drawdowns have been limited to 5%. With recent reading of 33 we believe; the risk reward remain favorable as pullback from bearish extremes cannot be ruled out.
* c) The US Dollar index has been sustaining below 107 marks for the second consecutive week. Further weakness would be beneficial for emerging markets.
* d) Brent crude is sustaining below $75, which augurs well for the Indian economy and equity markets.
Nifty Bank : 48652
Technical Outlook
Day that was…
Mirroring the benchmark move Bank Nifty started the week on a subdued note tracking weak global cues . Bank Nifty settled Monday’s session at 48652 , down by 0 . 7 % . Meanwhile, Nifty PSU Bank index outperformed the benchmark index and closed the day on a negative note at 5953 , down by 0 .29 % .
Technical Outlook
* The Bank Nifty witnessed gap down opening . However, after initial decline, supportive efforts from 80 % retracement of preceding 2 weeks up move (47844 -50641 ) and gap zone (48319 -48449 ) helped index to recover most of the intraday losses . As a result, the daily price action created a long legged Doji candle, indicating supportive efforts at lower levels amid elevated volatility .
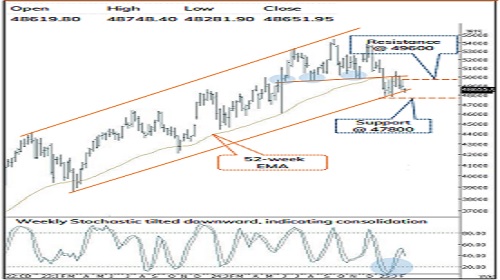
* Key point to highlight is that, the lack of follow through strength above previous session high signifies prolonged consolidation in the broader range of 49600 -48700 . Thus, making us believe that a breakout on either side of the range would dictate the further course of action, till then prolongation of consolidation will continue, amid elevated volatility .
* Structurally, the Bank Nifty is showing resilience as it did not breach the previous swing low contrary to the Nifty index and witnessed a higher low pattern formation around the lower band of 2 years rising channel, indicating relative strength . Thus, making us believe, that the index would eventually resolve higher and move beyond immediate hurdle of 49600 being previous week high coinciding with 52 -week EMA . In the process, the strong support is placed around the swing low of 47800 .
* In tandem with the benchmark index, the Nifty Private Bank index witnessed buying demand in the vicinity of 61 . 8 % retracement of the move from (23508 -25025), thus outperforming the benchmark move and closing the session with a Hammer candlestick pattern which indicates positive bias . Going ahead, we believe that the index will continue to resolve higher towards 24800 being previous weeks high coinciding with 52 -week EMA . Meanwhile, immediate support is placed at 23500 , being the recent swing low .
Please refer disclaimer at https://secure.icicidirect.com/Content/StaticData/Disclaimer.html
SEBI Registration number INZ000183631