

Nifty and Bank Nifty Weekly Outlook by Hitesh Tailor Research Analyst Choice Broking

NIFTY WEEKLY OUTLOOK
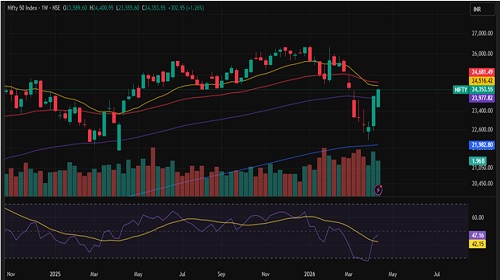
The Nifty index exhibited strong bullish momentum during the week, recovering sharply after an initial decline and closing higher by 302.95 points, after marking a weekly high of 24,400.95. On the weekly chart, the index has formed a strong bullish candle for the third consecutive week, indicating sustained buying interest and trend continuation.
On the daily timeframe, Nifty delivered a decisive close above the key resistance level of 24,300, ending the session at 24,353.55, which reflects strength and a successful breakout. The index continues to trade comfortably above its key moving averages—100-week and 200-week EMAs—thereby reinforcing the overall bullish trend and long-term structural strength. As long as Nifty holds above these levels, market sentiment is likely to remain positive and biased towards the upside.
On the upside, immediate resistance is placed at 24,500, followed by 24,700 and 25,000, while on the downside, support is seen at 24,000 and then at 23,900. A deeper breakdown below 23,700 could lead to further downside pressure. Given the current market structure, a buy-on-dips strategy remains appropriate; however, traders should remain disciplined and follow strict stop-losses in view of ongoing market volatility.
Support Levels:- 24,000 - 23,700
Resistance Levels:- 24,500 – 25,000
Overall Bias :-Sideway to Bullish
BANKNIFTY WEEKLY OUTLOOK
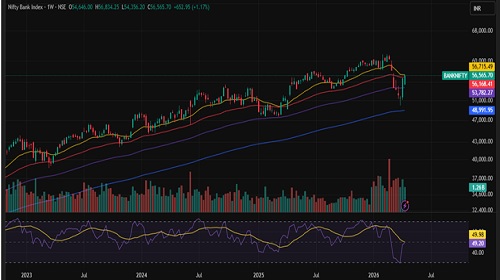
Bank Nifty ended the week on a positive note at 56,565.70, registering a weekly gain of 652.95 points (1.17%). The formation of three consecutive green weekly candles reflects sustained buying interest and a continuation of the upward trend. Price action strengthened notably following the breakout above the crucial 56,500 resistance level, and the index closed above the 50-week EMA, which typically signals a bullish medium-term outlook.
The index has now gained nearly 13% from its recent lows, suggesting a strong recovery in sentiment. In the near term, immediate downside support is placed in the 55,750–54,350 zone in case selling pressure re-emerges. On the upside, 57,100 acts as the immediate resistance, while 57,700 and 58,840 stand as the next key supply zones.
From a momentum standpoint, the weekly RSI at 49.20 indicates moderate strength with scope for further upside, as it remains below overbought levels. A sustained close above 57,100 could signal strengthening bullish momentum and potentially trigger further recovery. Given the current structure, a “buy on dips” strategy remains favourable, though traders should maintain strict stop-loss measures to manage risk in this volatile market environment.
Support: 55,750–54,350
Resistance: 57,100–58,840
Overall Bias:- Sideways to Bullish
For Detailed Report With Disclaimer Visit. https://choicebroking.in/disclaimer
SEBI Registration no.: INZ 000160131


More News
Debt Monthly Observer -July 2026 by Sneha Pandey, Fund Manager, Fixed Income, Quantum AMC


