Muhurat Picks Report 2025 by LKP Securities Ltd

Bajaj Finance Ltd
Buy Bajaj Finance Ltd @ 1030 Target 1260 Stop Loss 937 Potential Upside 22%
Technical Outlook
* The stock has moved up after a few weeks of consolidation, indicating a rise in optimism.
* Moreover, it has surpassed its previous swing high, reinforcing the bullish sentiment.
* The RSI (14) is in a bullish crossover and trending higher.
* On the upper side, the stock may move towards 1,260, while on the lower side, support is placed at 937.
Divi's Laboratories Ltd
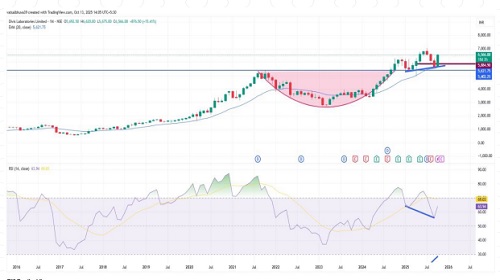
Buy Divi's Laboratories Ltd @ 6550 Target 8200 Stop Loss 5700 Potential Upside 25%
Technical Outlook
* After a strong rally and brief retracement on the monthly chart, the stock has formed a bullish candlestick with a hidden bullish divergence and is now trading above its key resistance level of 6250.
* On the weekly chart, the stock closed above its 20-week EMA, forming a bullish candlestick, indicating strength in the ongoing trend.
* On the daily chart, RSI has entered a bullish crossover along with positive divergence, reinforcing bullish momentum.
* These technical indications suggest a continuation of the uptrend after a phase of retracement and consolidation.
FSN E-Commerce Ventures Ltd
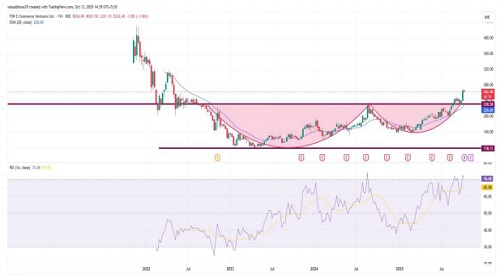
Buy FSN E-Commerce Ventures Ltd @ 262 Target 340 Stop Loss 222 Potential Upside 30%
Technical Outlook
* On the monthly chart, the stock has given a strong breakout above its key resistance level of 230, indicating long-term strength.
* On the weekly chart, the stock has formed and confirmed a rounding bottom breakout, signaling a major trend reversal.
* On the daily chart, the stock is trading comfortably above its 20-day EMA, reflecting short-term bullish momentum.
* RSI shows a bullish crossover across multiple time frames — monthly, weekly, and daily — supporting the continuation of the upward momentum
SBI Cards and Payment Services Ltd.
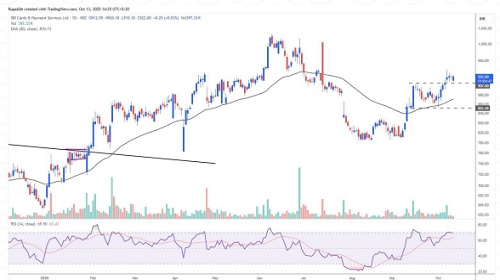
Buy SBI Cards and Payment Services Ltd @ 921 Target 1100 Stop Loss 818 Potential Upside 19%
Technical Outlook
* The stock has broken above its previous consolidation on the daily chart, indicating rising optimism.
* Moreover, the price has been sustaining above the 21EMA on the weekly chart.
* The momentum indicator RSI is in a bullish crossover and trending higher.
* On the upper side, the stock may move towards 1,100 within the next 9–12 months, while a fall below 818 could lead to a loss of momentum
State Bank of India Ltd
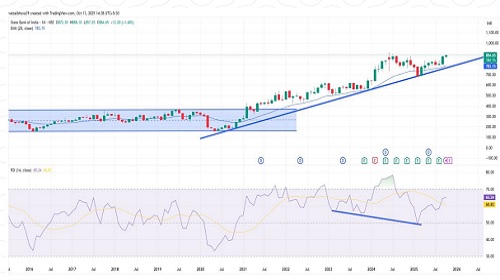
Buy State Bank of India Ltd @ 880 Target 1050 Stop Loss 775 Potential Upside 19%
Technical Outlook
* On the monthly chart, the stock is in a clear uptrend, taking support at its rising trendline and giving a strong closing above its 20 EMA in the previous month, after a breakout from a sideways trend or channel in May 2021.
* On the weekly chart, the stock has given a consolidation breakout and is sustaining above its 20-week EMA, with RSI showing a bullish crossover.
* These technical indicators suggest the continuation of the uptrend with sustained momentum in the coming sessions.
Swiggy Ltd
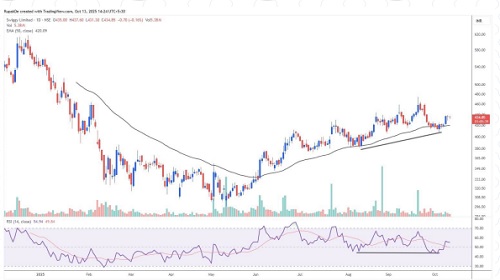
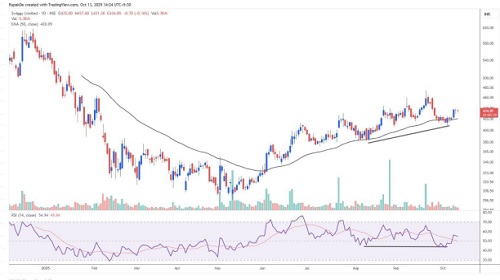
Buy Swiggy Ltd @ 434 Target 540 Stop Loss 390 Potential Upside 24%
Technical Outlook
* The stock has moved higher after retesting the 21EMA on the weekly chart.
* It has been in a strong uptrend since forming a low around 300.
* The 21EMA and 50EMA are in a bullish crossover on the weekly timeframe.
* On the daily chart, a hidden positive divergence is visible, indicating a potential shift in price momentum.
* Over the medium term, the stock may move towards 540, while on the lower end, support is placed at 390.
Above views are of the author and not of the website kindly read disclaimer