MOSt Quantitative Outlook Monthly - 7th Aug'26 by Motilal Oswal Wealth Mangement

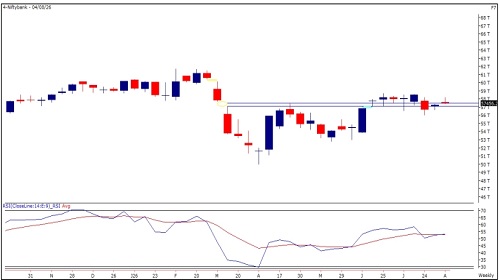
Bank Nifty
Bank Nifty started July on a positive note and tested the 58600 zone in the first half of the month. However it failed to sustain at higher levels and witnessed profit booking in the latter half dragging the index towards the 56000 mark. Support based buying emerged at lower levels, but follow up buying remained absent at higher zones resulting in the index closing marginally below the previous month's closing. On the monthly scale it formed a small bearish candle, suggesting selling pressure at higher levels while support based buying remains intact. Price action suggests that a hold above 58000 zones could see momentum driving towards 59500 then 60500 zones while on the downside support is placed at 57000 and then 56500 zones.
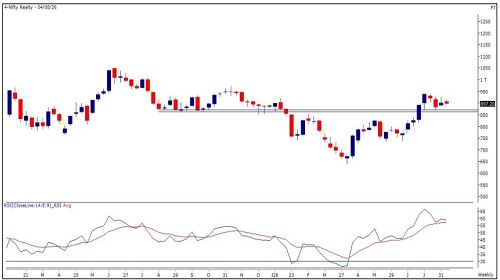
Nifty Realty Index
The Nifty Realty Index has successfully reversed its prolonged downtrend after consistently forming lower highs and lower lows over the past several months. The recent breakout above the previous swing high signals a positive shift in the overall trend. Following a sharp recovery, the index is undergoing a healthy phase of consolidation while continuing to find support around the 20 DEMA, highlighting sustained buying interest at lower levels. The current chart structure suggests further upside towards 940 & 980 zones, while support is expected in the 840 and 820 range.
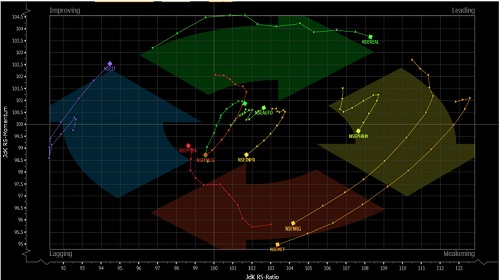
Relative Rotation Graphs (RRG):
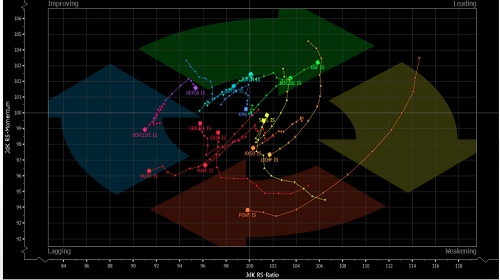
Relative rotation graphs chart shows the relative strength and momentum for group of Stocks/ Indices. It allows us to compare a security against the benchmark to see if it is outperforming or underperforming the benchmark. It is derived on Relative strength in which value of a sector is divided by the value of index mainly a benchmark which allows us to compare the performance of the sector. Relative Strength ratio is normalized to oscillate around 100 (plotted on X axis) i.e Jdk RS- Ratio along with this it provides the speed and direction of the Relative strength ratio (plotted on Y axis) i.e Jdk RS - momentum. The scatter plot is divided into four quadrants i.e Leading, Weakening, Lagging and Improving quadrant.
The analysis of sectoral RRG shows that Realty and Auto are in the Leading Quadrant, which indicates strength going ahead. Infrastructure, Energy, Pharma and Metal are placed in the Weakening Quadrant, suggesting that momentum is likely to decline. FMCG and PSU Bank are in the Lagging Quadrant, which shows that both strength and momentum are missing. IT is in the Improving Quadrant, indicating that strength is still low but momentum is gradually improving.
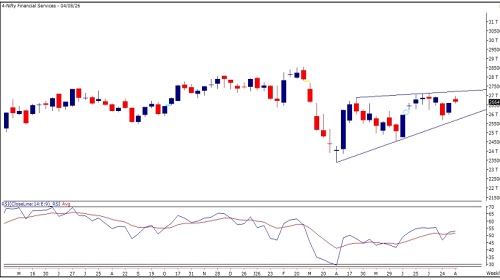
Nifty Financial Services Index
The Nifty Financial Services Index is approaching a multi-month breakout after consolidating within a broad range over the past few months. The index has recently reclaimed all its key exponential moving averages, including the 20, 50, 100 and 200 DEMA, reflecting a notable improvement in trend strength. A sustained move above the 27200 mark is likely to confirm the breakout and pave the way for further upside towards the 27900 & 28200 zones. On the downside, immediate support is placed at 26000, followed by a stronger support zone around 25600.
RRG For Nifty Financial Services
The analysis of RRG for Financial stocks shows that Bajaj Finance, ICICI Bank and Bajaj Finserv are in the Leading Quadrant, which indicates strength going ahead. Shriram Finance, LIC Housing Finance and Axis Bank are placed in the Weakening Quadrant, suggesting that momentum is likely to decline. SBIN, Max Financial, SBI Life, Muthoot Finance, PFC and HDFC Life are in the Lagging Quadrant, which shows that both strength and momentum are missing. Kotak Bank, Jio Financial Services and HDFC Bank are in the Improving Quadrant, indicating that strength is still low but momentum is gradually improving
Nifty Auto Index
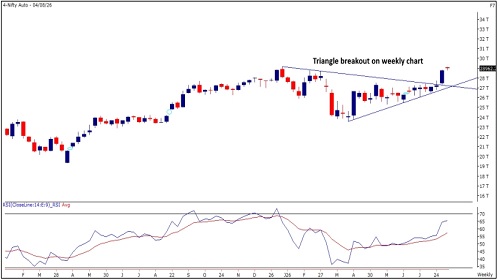
The Nifty Auto Index has registered a decisive breakout by surpassing its previous peak recorded in January 2026, indicating a continuation of the prevailing uptrend. The rally has been supported by strong automobile sales data, which has further strengthened market sentiment. Momentum indicators remain constructive, with the RSI maintaining an upward trajectory while the index continues to trade above all major DEMA levels. Based on the current technical structure, the index has the potential to advance towards the 29800-30150 zones. Key support levels are positioned at 28200 and 27800.
RRG For Nifty Auto
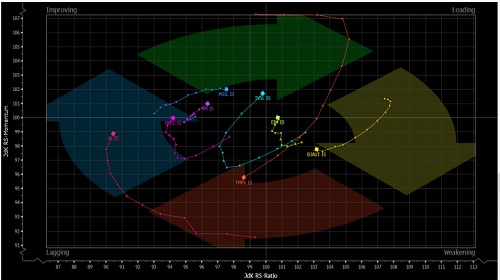
The analysis of RRG for Auto stocks shows that Eicher Motors is in the Leading Quadrant, which indicates strength going ahead. Bajaj Auto is placed in the Weakening Quadrant, suggesting that momentum is likely to decline. Tata Motors Passenger Vehicles (TMPV), Ashok Leyland and Hero Moto Corp are in the Lagging Quadrant, which shows that both strength and momentum are missing. M&M, TVS Motor and Maruti are in the Improving Quadrant, indicating that strength is still low but momentum is gradually improving
India VIX
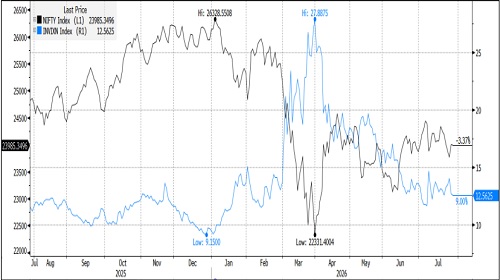
India VIX decreased by 7.65% from 13.60 to 12.56 levels in the June series. It cooled off below 9.5 levels during the month and paved way for support based buying at any minor dip.
Nifty OI V/S Price
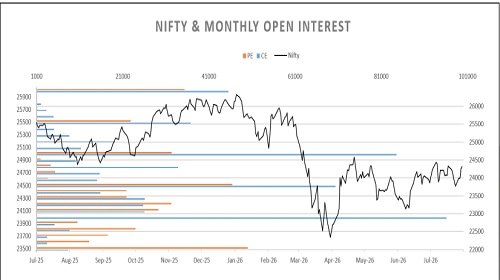
Rollover of Nifty stood at 71.8%, which is lower than the quarterly average of 74%. In the July series, open interest decreased by 25.3% while the index rose by 0.5% on an expiry-to-expiry basis indicating short covering move in the index. Rollover in Bank Nifty stood at 76.3%, which is in line with its quarterly average. Bank Nifty ended the July series with losses of 1.4% with a decrease in open interest by 1.1% indicating marginal long liquidation in the rate sensitive index. Nifty begins the August series with open interest of 14.53 mn shares as compared to 19.45 mn shares at the start of the July series.
Nifty index began the July series on a flattish note and witnessed sharp swings on either sides throughout the series. It initially rallied towards 24500 zones but failed to sustain at higher levels and drifted lower towards 23600 zones before witnessing renewed buying from support levels. It recovered from the lower zones but some rub off was seen towards the end as the index surrendered part of its gains as the series concluded. On an expiry-to-expiry basis, Nifty formed a small bodied bullish candle with longer shadows suggesting support based buying is intact but a decisive follow up is required at the higher levels. Put Call Ratio based on Open Interest of Nifty started the series near 1.13 and oscillated between 0.80 to 1.43 levels to finally end the series again at 1.05. On option front, Maximum Call OI is at 25000 then 24500 strike while Maximum Put OI is at 24000 then 23500 strike. Call writing is seen at 24800 then 24400 strike while Put writing is seen at 24400 then 24500 strike. Option data suggests a broader trading range in between 23500 to 25200 zones while an immediate range between 24200 to 25000 levels.
For More Research Reports : Click Here
For More Motilal Oswal Securities Ltd Disclaimer
http://www.motilaloswal.com/MOSLdisclaimer/disclaimer.html
SEBI Registration number is INH00000041