MOSt Quantitative Outlook Monthly by Motilal Oswal Wealth Mangement
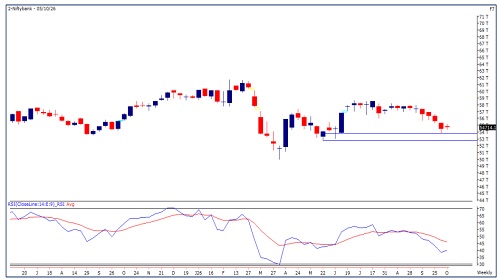
Bank Nifty Bank
Nifty started September on a cautious note with selling pressure and is forming lower highs from the last four months as it gradually slipped below 53800 zone to close near its lower band, indicating sell on bounce in the broader trend. The index witnessed support based buying near the lower zones but failed to attract any meaningful follow up buying, keeping the overall upside capped during the month. On the monthly scale, Bank Nifty formed a bearish candle and for October, positional supports are seen at 53500 and then 53000 zones, while on the upside hurdles are placed at 55500 then 56500 zones.
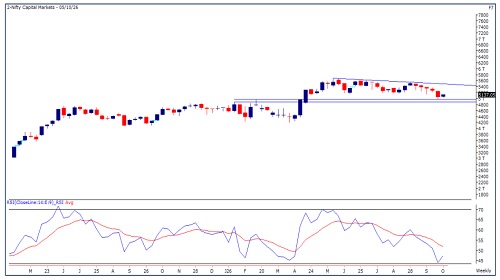
Nifty Capital Markets
The Nifty Capital Markets Index continues to maintain its broader uptrend on the monthly chart, with the longterm higher highs - higher lows structure remaining intact. After registering a strong rally and reaching recordhigh levels, the index has entered a consolidation phase over the last few months while continuing to trade firmly above its rising 20 month EMA. The RSI has cooled from the overbought levels but remains above the 50 mark, suggesting that the broader positive momentum remains intact despite the recent correction and consolidation. The index could see further upside towards the 5250-5400 range, while the 5000-4900 zone is likely to provide support on any pullback.
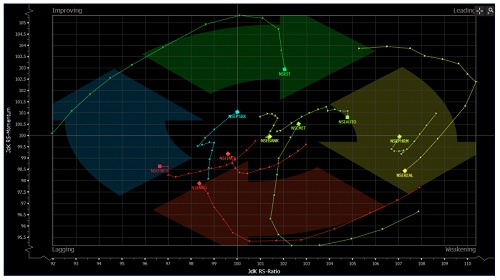
Relative Rotation Graphs (RRG):
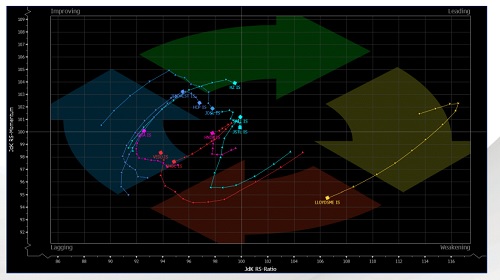
Relative rotation graphs chart shows the relative strength and momentum for group of Stocks/ Indices. It allows us to compare a security against the benchmark to see if it is outperforming or underperforming the benchmark. It is derived on Relative strength in which value of a sector is divided by the value of index mainly a benchmark which allows us to compare the performance of the sector. Relative Strength ratio is normalized to oscillate around 100 (plotted on X axis) i.e Jdk RS- Ratio along with this it provides the speed and direction of the Relative strength ratio (plotted on Y axis) i.e Jdk RS- momentum. The scatter plot is divided into four quadrants i.e Leading, Weakening quadrant, Lagging and Improving quadrant.
The analysis of sectoral RRG shows that IT, Auto and Metal are in the Leading Quadrant, which indicates strength going ahead. Pharma, Banking and Realty are placed in the Weakening Quadrant, suggesting that momentum is likely to decline. Infrastructure, Energy and FMCG are in the Lagging Quadrant, which shows that both strength and momentum are missing. PSU Bank is in the Improving Quadrant, indicating that strength is still low but momentum is gradually improving.
Nifty Pharma
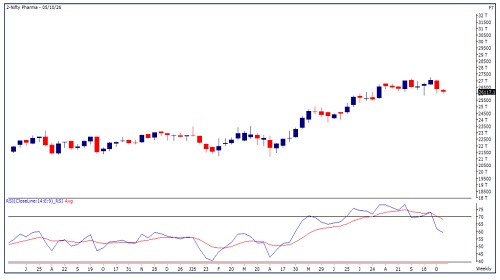
The Nifty Pharma Index remains structurally strong on the monthly chart, with the broader higher highs - higher lows formation firmly intact. The recent correction appeared to be profit booking following the sharp rally. The index continues to trade comfortably above its rising 20 MEMA keeping the broader bullish trend intact. The index has the potential to extend its recovery towards 26850 then 27400 zones while on the downside, immediate support is placed near 25550 then 25000 levels.
RRG For Pharma Sector
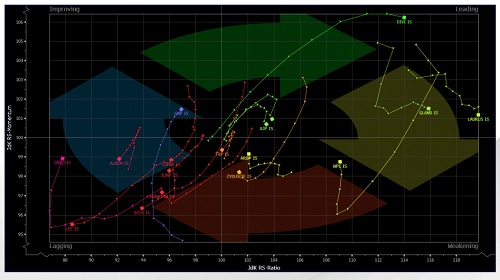
The analysis of RRG for Pharma stocks shows that Divi’s Labs, Gland Pharma, Laurus Labs and Ajanta Pharma are in the Leading Quadrant, which indicates strength going ahead. Wockhardt, Aurobindo Pharma and Torrent Pharma are placed in the Weakening Quadrant, suggesting that momentum is likely to decline. Sun Pharma, Lupin, Biocon, Mankind Pharma, Cipla, Alkem Laboratories and Dr. Reddy’s are in the Lagging Quadrant, which shows that both strength and momentum are missing. Glenmark Pharma is in the Improving Quadrant, indicating that strength is still low but momentum is gradually improving.
Nifty Metal Index
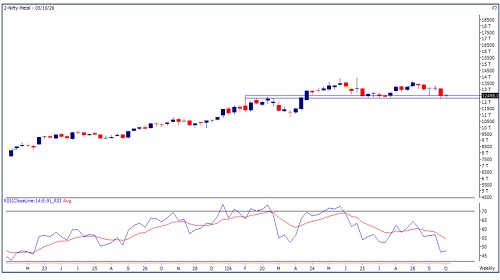
The Nifty Metal Index has witnessed a strong structural breakout over the last few months, pushing the index to fresh record highs. The index is currently witnessing some profit booking from higher levels but continues to trade comfortably above its 50 month EMA, keeping the broader bullish structure intact. The mechanical indicator RSI is holding above the 60 mark suggests that underlying momentum remains healthy despite the recent pullback. The index has the potential to extend its upward move towards the 12850 then 13100 zones while on the downside, immediate support is placed at 12250 followed by a stronger support zone near 11950 marks.
RRG For Nifty Metal
The analysis of RRG for Metal stocks shows NMDC, Vedanta, Hindalco and Tata Steel are in the Lagging Quadrant, which shows that both strength and momentum are missing. JSW Steel, SAIL, Jindal Steel, Hindustan Copper and Hindustan Zinc are in the Improving Quadrant, indicating that strength is still low but momentum is gradually improving.
India VIX
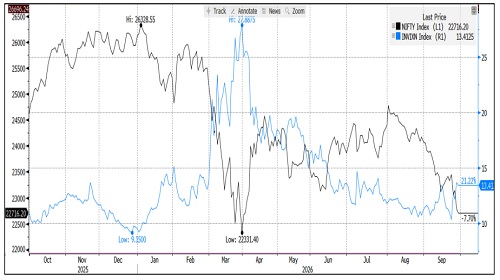
India VIX increased by 21.01% from 11.07 to 13.41 levels in the September series. It spiked above 14.7 levels amidst global tensions and gave some discomfort to the market.
Nifty OI V/S Price
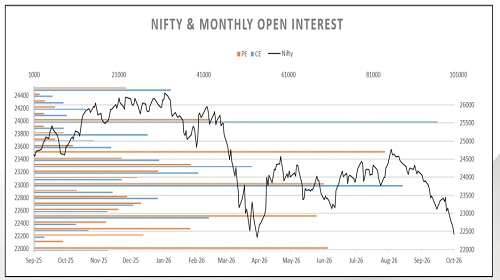
Rollover of Nifty stood at 74.3%, which is in line with its quarterly average of 74.5 In the September series, open interest increased by 29.8% while the index fell by 6.7% on an expiry-to-expiry basis indicating built up of short position. Rollover in Bank Nifty stood at 79.3%, which is in line with its monthly and quarterly average of 78.3%. Bank Nifty ended the September series with losses of 5.7% with an increase in open interest by 15.6% indicating short built up in the rate sensitive index. Nifty begins the October series with open interest of 19.13 mn shares as compared to 14.74 mn shares at the start of the September series.
Nifty index started the September series on a flattish note but witnessed sustained selling as the series progressed. The index initially moved towards 24100 zones but failed to sustain at higher levels and gradually slipped towards 22500 zones as it approached expiry. Every bounce attracted fresh selling and dragged the index to close near its lower band. On an expiry-to-expiry basis, it formed a bearish candle indicating that sellers retained control throughout the series. Put Call Ratio based on Open Interest of Nifty started the series near 0.91 and oscillated between 1.20 to 0.69 levels to finally end the series again at 0.91. On the option front, Maximum Call OI is at 23500 then 23000 strike while Maximum Put OI is at 23000 then 22500 strike. Call writing is seen at 22500 then 22600 strike while Put writing is seen at 22500 then 22200 strike. Option data suggests a broader trading range in between 21500 to 23500 zones while an immediate range between 22000 to 23000 levels.
For More Research Reports : Click Here
For More Motilal Oswal Securities Ltd Disclaimer
http://www.motilaloswal.com/MOSLdisclaimer/disclaimer.html
SEBI Registration number is INH000000412










Tag News
Market Round-up 26th October 2026 by Motilal Oswal Wealth Management Ltd