Indian equity benchmarks staged a decent recovery ahead of RBI policy and settled at 22535, up 1.69% - ICICI Direct

Nifty :22535
Technical Outlook
Day that was…
Indian equity benchmarks staged a decent recovery ahead of RBI policy and settled at 22535, up 1.69%. Market breadth was in favor of advances, with a staggering A/D ratio of 5:1, as the broader market outperformed. Both the Nifty Midcap and Small cap indices closed 2% positive. Sectorally, all sectors closed in green, where PSU Bank, Consumer Durable and Realty were outperformers.
Technical Outlook:
• The Nifty opened with a gap-up (22161-22446) and paired initial gain however supportive efforts in the vicinity of previous session high led to a gradual recovery making new intraday high. As a result, the daily price action formed high wave candle, indicating positive bias amid elevated volatility.
• The index is likely to witness gap down opening tracking weak global cues after US president signed an executive order imposing an additional 50% tariff on China which brings the total tariff rate to 104%. Consequently, US equities witnessed decline and S&P VIX jumped 11% to settle at 52 levels, indicating extreme bearish sentiment in the market. Key point to highlight is that, despite high volatility, the index closed on a positive note indicating inherent strength. However, the broader bias remains corrective as long as the Nifty trades within the gap-zone (22857-22254). Further, index need to decisively close above 22900 mark and fill the gap for extended pullback to materialize. On the downside March lows of 21900 will be the key level to monitor and only a decisive close below it would result into extended correction towards 21500- 21200 zone as it is 123.6% external retracement of recent pullback of (21965- 23870) coincided with Election Day low of 21281. In the process, volatility is expected to remain elevated amid Tariff related development, the upcoming US inflation print, and Wednesday’s RBI Policy and the onset of the Q4 earnings season.
• Historically, since 2002, within a structural bull market, maximum intermediate corrections have typically been to the tune of 16-18% (barring 2004 & 2006). Historically, buying in such scenario has been rewarding, delivering an average return of 15% over the subsequent three months. While navigating through the current global volatility, we are witnessing some silver linings that could act as tailwinds for the domestic market, details listed below:
• a. Bank Nifty: The banking space has shown relative outperformance by sustaining above its 52 weeks low. Going ahead, holding above the March lows of 47700 on a closing basis will keep the pullback possibility open.
• b. Global Macros: Weakness in US 10-year bond yields, the Dollar index, and Brent crude oil corrected towards $60 which bodes well for domestic markets.
• c. RBI Policy: Clarity on a potential rate cut in Wednesday’s RBI's policy meet would boost market sentiment.
• d. Bullion: Further profit booking in precious metals could lead to a shift in asset allocation, benefiting equities.
• We expect volatility to prevail amid ongoing global uncertainty. Consequently, we revise our support base at 21900 and only a decisive close below it would result into extended correction towards the 21500-21200 zone, as it aligns with the 123.6% external retracement of the recent pullback (21965-23870), also matching the Election Day low of 21281

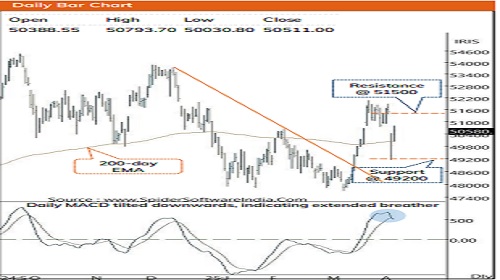
Nifty Bank : 50511
Technical Outlook
Day that was :
The Bank Nifty index witnessed gap -up opening ahead of RBI Monetary Policy and observed range bound action to the settle the volatile session on a positive note at 50511 , up by 1 .31 % . Meanwhile, the Nifty PSU Bank index outperformed the benchmark and settled at 6250 , up by 2 .64 % .
Technical Outlook :
• The Bank Nifty witnessed follow through strength from the preceding trading session where it opened the day with a gap - up and soon filled the previous gap area (51360 -50426), thus continuing the bullish bias . However, the index witnessed range bound action throughout the day where it traded in a broader range of ~750 points, amid volatility due to tariff uncertainty and created a high wave candle with small bull body .
• Going ahead, sustenance above the Tuesdays high of 50800 post RBI policy, will result in an extended pullback towards 51500 being 80 % retracement of the recent fall (52064 - 49157 ) . However, on the downside the immediate support is placed at the mark of 49200 , being recent swing low . Meanwhile, volatility would prevail amid tariff development coupled with RBI Monetary Policy .
• Structurally, the Bank Nifty is showing resilience, as it retraced only 61 . 8 % of the previous up -move as compared to the benchmark index which on the other hand retested the previous swing low . Additionally, the bank Nifty is witnessing base formation near the lower band of 2 years rising channel, indicating relative outperformance .
• Mirroring the benchmark index, the Nifty PSU Bank index witnessed a follow through buying from the preceding trading session and filled the previous gap area (6238 -6117), closing the session with a bullish bias . However, to continue the ongoing upward momentum the index needs to decisively close above the high of Tuesdays session (6270), which will result in extended pullback towards the previous swing high of 6480 . Meanwhile, on the downside the immediate support is placed at the recent swing low of 5904
Please refer disclaimer at https://secure.icicidirect.com/Content/StaticData/Disclaimer.html
SEBI Registration number INZ000183631