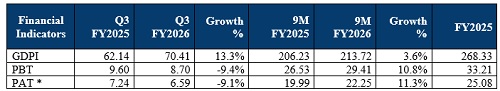
ICICI Lombard Q3 Results: Reports premium growth of 13.3% at Rs.70.41 billion

* Gross Direct Premium Income (GDPI) of the Company on a 1/n basis was at Rs.213.72 billion in 9M FY2026 compared to Rs.206.23 billion in 9M FY2025, a growth of 3.6%, as against the industry growth of 8.7%. Excluding Crop and Mass Health, GDPI growth of the Company on a 1/n basis was at 7.5%, as against the industry growth of 13.3% in 9M FY2026.
* GDPI of the Company on a 1/n basis was at Rs.70.41 billion in Q3 FY2026 compared to Rs.62.14 billion in Q3 FY2025, a growth of 13.3%, as against the industry growth of 11.5%. Excluding Crop and Mass Health, GDPI growth of the Company on a 1/n basis was at 16.4%, as against the industry growth of 20.1% in Q3 FY2026.
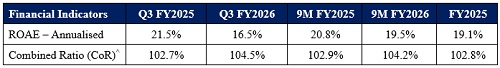
* Combined ratio on 1/ n basis was at 104.2% in 9M FY2026 compared to 102.9% in 9M FY2025. Combined ratio on n basis was at 103.1% in 9M FY2026 compared to 102.8% in 9M FY2025.
* Combined ratio on a 1/n basis was at 104.5% in Q3 FY2026 compared to 102.7% in Q3 FY2025. Combined ratio on n basis was at 103.1% in Q3 FY2026 compared to 102.3% in Q3 FY2025.
* Excluding the impact of CAT losses of Rs.0.84 billion in 9M FY2026 and Rs.0.94 billion in 9M FY2025, the Combined ratio on 1/n basis was 103.7% and 102.9% respectively.
* Excluding the impact of CAT losses of Rs.0.11 billion in Q3 FY2026, the Combined ratio was 104.3%. There were no CAT losses for Q3 FY2025.
* Pursuant to the implementation of the Code on Social Security, 2020, effective November 21, 2025, there was an impact of Rs.0.55 billion in Q3 FY2026. Excluding this impact, CoR on 1/n basis was 103.9% & 103.5% for 9M FY2026 and Q3 FY2026 respectively. Excluding this impact, on n basis CoR was 102.8% and 102.2% for 9M FY2026 and Q3 FY2026 respectively.
* Profit before tax (PBT) grew by 10.8% to Rs.29.41 billion in 9M FY2026 compared to Rs.26.53 billion in 9M FY2025.
* PBT de-grew by 9.4% to Rs.8.70 billion in Q3 FY2026 compared to Rs.9.60 billion in Q3 FY2025. Capital gains was at Rs. 9.33 billion in 9M FY2026 compared to Rs. 7.96 billion in 9M FY2025. Capital gains was at Rs.3.17 billion in Q3 FY2026 compared to Rs.2.76 billion in Q3 FY2025.
Consequently, Profit after tax (PAT) on a 1/n basis grew by 11.3% to Rs.22.25 billion in 9M FY2026 compared to Rs.19.99 billion in 9M FY2025.
* PAT on a n basis grew by 13.8% to Rs.22.22 billion in 9M FY2026 compared to Rs.19.53 billion in 9M FY2025. Excluding impact of Wage Code on a 1/n basis PAT for 9M FY2026 was Rs.22.67 billion, registering a growth of 13.4%. Excluding impact of Wage Code on n basis PAT for 9M FY2026 was Rs.22.64 billion, registering a growth of 15.9%.
* PAT on a 1/n basis de-grew by 9.1% to Rs.6.59 billion in Q3 FY2026 from Rs.7.24 billion in Q3 FY2025. PAT on n basis grew by 0.2% to Rs.6.80 billion in Q3 FY2026 from Rs.6.79 billion in Q3 FY2025. Excluding impact of Wage Code on a 1/ n basis PAT for Q3 FY2026 was Rs.7.00 billion, registering a de-growth of 3.3%. Excluding impact of Wage Code on a n basis PAT for Q3 FY2026 was Rs.7.21 billion, registering a growth of 6.3%.
* Return on Average Equity (ROAE) on a 1/n basis was at 19.5% in 9M FY2026 compared to 20.8% in 9M FY2025. Excluding impact of Wage Code on a 1/n basis ROAE for 9M FY2026 was 19.8%.
* ROAE on a 1/n basis was at 16.5% in Q3 FY2026 compared to 21.5% in Q3 FY2025. Excluding impact of Wage Code on 1/n basis RoAE for Q3 FY2026 was 17.5%.
* Solvency ratio was at 2.69x as at December 31, 2025 as against 2.73x as at September 30, 2025 which was higher than the minimum regulatory requirement of 1.50x. Solvency ratio was at 2.69x as at March 31, 2025.
Operating Performance on a 1/n basis:
Ratios on a 1/n basis:
Above views are of the author and not of the website kindly read disclaimer


More News
India's RBI likely used dollar deposit surge to cut record FX forward book, economists say