
Hold LatentView Analytics Limited For Target Rs. 215 by ARETE Securities Ltd
.jpg)
LatentView Analytics reported a steady 2QFY27, with revenue growing 14.2% YoY and 2.5% QoQ to Rs 2,941 mn (US$30.9 mn, +2.0% QoQ), led by industrials (+21.4% QoQ, +68.8% YoY), while technology, the largest vertical, stayed flat (-0.3% QoQ). Revenue was 2.8% below our estimates. Adjusted EBITDA rose 4.8% YoY to Rs 608 mn, with the adjusted EBITDA margin improving 30 bps QoQ to 20.7% (-190 bps YoY), as GTM cost rationalisation and lower marketing spend offset the impact of a higher bench and wage hikes; gross margin fell 270 bps QoQ to 45.3%. EBIT grew 6.5% YoY and 7.1% QoQ to Rs 487 mn (EBIT margin 16.6%, +71 bps QoQ), 1.5% ahead of our estimates, while PAT rose 6.1% YoY to Rs 485 mn, 2.0% below our estimates on lower other income. Management guided FY27 organic revenue of US$127 mn (~6% YoY; US$125 mn already signed and locked in), down from the 12% growth guided earlier, and maintained EBITDA margin guidance of 21-22%.
Management call highlights
- Revenue grew 2.0% QoQ in USD terms to US$30.9 mn, led by Industrials (+21.4%), Financial Services (+3.5%) and Retail & CPG (+2.7%). Technology (55% of revenue) was flat (-0.3%) on budget cuts at a gaming client; management believes it has bottomed out but expects FY27 to be flat-to-negative.
- FY27 organic revenue guided at US$127 mn (~6% YoY), of which US$125 mn is signed and locked in. EBITDA margin guidance maintained at 21-22%.
- Industrials (9% of revenue) grew 68.8% YoY on auto clients and could scale to ~US$25 mn, the size of financial services, over the medium term.
- Won 11 deals (vs. 5-6 per quarter on average), the largest ~US$0.85 mn, including agentic AI projects built on Observe Mate.
- Adjusted EBITDA margin rose to 20.7% (from 20.4%): higher bench and wage hikes (-190 bps) were offset by GTM cost rationalisation (+120 bps) and lower marketing costs (+110 bps). Gross margin fell to 45.3% (from 48.0%); utilisation was 84%.
- Top-5 clients at 56% of revenue (-1 pp QoQ); headcount rose to 1,779 (+52 QoQ); LTM attrition stable at 25%.
- Healthcare and life sciences (~US$20 mn) is a key pillar of the US$200 mn CY28 aspiration; the Databricks partnership has ~US$30 mn of influenced revenue.
Outlook and Valuation
2QFY27 saw a sequential recovery, led by industrials (+68.8% YoY) and an above-average 11 deal wins. However, the FY27 revenue guidance cut to ~6% (US$127 mn, from 12% earlier) reflects continued weakness in technology, the largest vertical. With US$125 mn already locked in, visibility is high, and we now build in FY27E revenue of ~US$127 mn, in line with guidance. Factoring in slower growth, the wage hike and a higher bench, we cut FY27E/FY28E/FY29E EPS by 9%/11%/12% and now expect Revenue/EBITDA/PAT CAGR of ~13%/~11%/~9% over FY26-29E, with EBITDA margins of 20.8%/21.0%/21.3% for FY27E/FY28E/FY29E, below management’s 21-22% guidance for FY27.
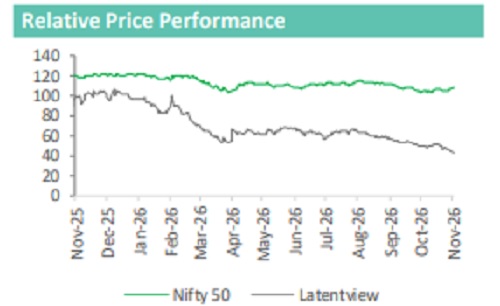
We value the stock at 18x (from 20x) one-year forward (Sep-28E) EPS of Rs 11.92 to arrive at a revised target price of Rs 215 (from Rs 258), implying 9% upside from the CMP of Rs 196. We cut the multiple as PAT CAGR slows to ~9% (FY27E PAT +2%), FY27 revenue guidance was halved to ~6% and technology remains weak; 18x is in line with the multiple of the core business ex-cash (~35% of market cap). We maintain our HOLD rating.
We cut our estimates to reflect the lower FY27 revenue guidance and the margin pressure seen in 2QFY27:
• Revenue (-4%/-7%/-7% for FY27E/FY28E/FY29E): FY27 revenue guidance was lowered to US$127 mn (~6% YoY) from 12% growth earlier, with the technology vertical (55% of revenue) expected to be flat-to-negative. We now assume revenue per employee grows 2.5% QoQ in 2HFY27 (from 4.5%), taking FY27E/FY28E USD revenue to US$127 mn/US$142 mn (from US$133 mn/US$153 mn).
• EBITDA margin (-100bps/-81bps/-100bps): wage hikes effective 1 July, a higher bench (utilization at 84%) and gross margin compression (45.3% vs. 48.0% in 1QFY27) lead us to build in EBITDA margins of 20.8%/21.0%/21.3%, at or below the lower end of management's 21- 22% guidance.
• EPS (-9%/-11%/-12%): the cut flows from lower EBITDA, lower other income (FY27E Rs 838 mn vs. Rs 888 mn earlier) and a higher effective tax rate (26.5% vs. 25.8%), partly offset by lower finance costs (Rs 93 mn vs. Rs 120 mn).
Please refer disclaimer at http://www.aretesecurities.com/
SEBI Regn. No.: INM000012