Financials BFSI Sector Update : Diversified sector performance in a rising K-shaped world by Motilal Oswal Financial Services Ltd

Private banks’ weight has declined; healthy earnings outlook to drive performance
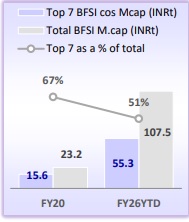
* Amid a global K-shaped recovery, the BFSI sector has delivered a broad-based sector performance across sub-segments, with rising contributions from PSU banks, NBFCs, capital markets, and fintechs. This has reduced the market-cap dominance of the top seven stocks from 67% in FY20 to 51% in FY26.
* As BFSI wealth creation broadens beyond large incumbents, active fund management— driven by stock selection, sector rotation, and timely identification of emerging franchises—has become increasingly important for generating portfolio alpha.
* BFSI sector weight in the Nifty-50 remained broadly stable at ~37% in FY26, with private banks’ weight falling to 26.2% from 28.9% due to a reduction in the weights of key private banks, while PSU banks, NBFCs, and new-age financial platforms have witnessed an increase in weight, driven by stronger earnings momentum and steady growth.
* Muted performance for most large private banks, despite strong fundamentals, has made valuations attractive, and we expect stock performance to improve as earnings gain acceleration from FY27. PSBs have outperformed on the back of improving growth outlook and healthy profitability metrics, supported by reasonable valuations.
* We estimate earnings to expand at ~16–18% CAGR over FY26–28 for banks and NBFCs. Top picks: SBIN, ICICIBC, HDFCB, and AUBANK.
BFSI: Diversified sector performance amidst K-shaped world recovery
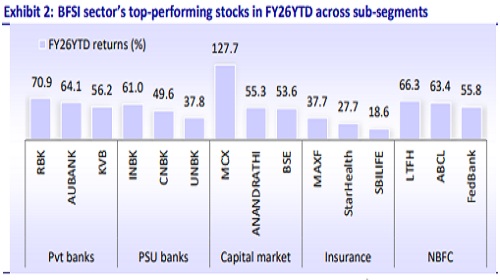
While the global recovery over the past five years has been largely ‘K-shaped’, with significant wealth concentrated among a handful of large companies and individuals, the BFSI sector has witnessed more diversified sector performance. Over the past decade, value creation within the sector has become significantly more broadbased, driven by the sharp turnaround of PSU banks, scaling NBFCs, emergence of new-age financial platforms, capital-market intermediaries, fintech-led players, alongside select banking franchises. Consequently, the dominance of the top-seven BFSI players has reduced meaningfully, from 67% in FY20 to 51% in FY26. This shift highlights the expanding breadth of the financial ecosystem, where multiple subsegments are now contributing to incremental wealth creation rather than overdependence on any one particular segment.
Active fund management has thus become all the more necessary
The widening opportunity set within BFSI has reshaped how investors approach the sector. Historically, wealth creation in financials was largely driven by a few dominant large-cap private banks and NBFCs, prompting many large investors to hold these names for extended periods in a largely passive investment strategy. However, as market-cap creation spreads across emerging financial platforms, capital-market players, and specialized NBFCs, identifying the right investment opportunities and assessing the business outlook have become increasingly critical. In such an environment, active fund management has gained importance, as stock selection, BFSI sector rotation, and capturing emerging financial franchises at the right valuations have become key drivers of portfolio alpha, rather than passively holding a handful of large incumbents.
Private banks: Dichotomy of strong fundamentals and weak stock performance?
* Large private banks delivered muted stock performance in FY26YTD, with both ICICIBC and HDFCB reporting 7% and 16% negative returns vs 24% and 6% CAGR returns over the prior two years. This has resulted in both ICICIBC and HDFCB trading close to the lower end of the three-year/two-year valuation range.
* Our discussions with investors suggest that while large private banks remain the most preferred franchises, given their balance sheet strength, earnings visibility, and superior risk management, a watchful stance persists due to relatively slower loan growth, intense competition for deposits, and the resurgence of PSU banks, which makes market share gains more challenging.
* The ongoing geopolitical situation, coupled with concerns over business growth and medium-term asset quality, has affected investor sentiment and triggered selling in private banks, which are heavily owned by FII investors. However, we view this phase as a transient one, as overall fundamentals remain strong, and a recovery in earnings growth over FY27E should support improved stock performance.
* This has made large private banks increasingly attractive, with current valuations indicating a more favorable risk–reward phase over the medium term.
PSU banks emerge as key outperformers within the banking sector
PSU banks have emerged as some of the strongest performers within the banking sector, supported by an improving growth outlook, robust asset quality, and sustained profitability. The PSU Bank index has delivered a robust 33% stock return over FY26YTD vs negative 3% returns from the Nifty-50 and 2% from the Nifty Bank index. This operational turnaround is reflected in individual stock performance as well, with most PSU banking stocks delivering robust returns. SBI delivered 34% returns during FY26YTD and continues to remain the preferred name for investors, given its liability strength, strong underwriting ability, and consistent earnings delivery.
How the BFSI sector weight is evolving ? Private Bank’s weight has declined
BFSI sector weight in the Nifty-50 index has increased sharply from ~15% in FY05 to ~37% in FY26, highlighting the rising dominance of financial services in India’s capital markets. Over FY26YTD, while the BFSI sector weight in the Nifty-50 has remained broadly stable at ~37%, private banks’ weight has declined to 26.2% from 28.9% due to a reduction in the weights of key constituents such as HDFCB (11.7% vs 13.3%), ICICIBC (8.5% vs 9.1%), and KMB (2.6% vs 3.0%), reflecting relative stock underperformance and index rebalancing over the period. In contrast, PSU banks’ weight increased modestly to 4.2% from 2.8%, while NBFC representation edged up to 5.3% from 4.8% in FY25, aided by the rising weights of companies like Shriram Finance.
BFSI – Which segments are gaining investor interest?
Fund flows in FY26 have largely moved away from large private banks toward segments with stronger earnings momentum and business outlook. The emergence of new-age companies, particularly capital market intermediaries, AMCs, and fintechs, has broadened the investible universe within the sector. Investors have incrementally preferred stocks offering better near-term alpha alongside steady growth and profitability. This includes PSU banks, which continue to deliver high RoEs with an improving growth trajectory, as well as select NBFCs such as Shriram Finance. In addition, capital market-linked businesses have attracted incremental interest, supported by rising penetration and steady business activity. Interestingly, new-age companies and BFSI listings have accounted for ~11% of the incremental market cap created within the BFSI sector over FY20–26YTD, reflecting strong investor appetite for asset-light, technology-driven financial franchises.
Global banks witnessing volatile returns amid macro uncertainties
Large global banks have also witnessed volatile performance over the past 6-12M amid macro uncertainties and geopolitical disruptions. While banks such as HSBC and Commonwealth Bank of Australia (CBA) have delivered strong 3/6 month returns, several large global banking institutions, including JPMorgan, Bank of America, and Wells Fargo, have witnessed negative returns over the past three to six months. This divergence reflects the impact of global disruptions, including higher interest rate volatility, slowing credit growth expectations, geopolitical risks, and concerns around economic slowdown.
Healthy profitability to sustain stock performance; remain OW on sector
* The BFSI sector has seen a notable improvement in profitability over the past decade, with banks and NBFCs emerging as the strongest profit drivers. Private banks reported >5x increase in PAT to INR1.9t over the past 10 years, while NBFCs reported ~4x surge to INR1.5t over the same period.
* PSU banks, after reporting aggregate losses of INR260b in FY20, have staged a remarkable turnaround to deliver aggregate PAT of INR1.8t in FY25, supported by cleaner balance sheets, controlled credit costs, and stronger capital buffers.
* This earnings recovery is further reinforced by several new listings across insurance, fintechs, and capital-market platforms, which are deepening profit pools and structurally increasing the sector’s contribution to overall market earnings.
* With unlisted fintech and wealth-tech players already contributing >20% of nonbank BFSI market cap and upcoming IPOs set to further expand their footprint, the sector’s structure is evolving meaningfully.
* While FY25/26 earnings growth has moderated due to NIM contraction and higher credit costs, MOFSL banking/NBFC coverage universe is estimated to report ~16-18% earnings CAGR over FY26-28E. Muted performance for most large private banks, despite strong fundamentals, has made valuations attractive, and we expect stock performance to improve as earnings gain momentum from FY27E onwards. Top picks: SBIN, ICICIBC, HDFCB, and AUBANK.
For More Research Reports : Click Here
For More Motilal Oswal Securities Ltd Disclaimer
http://www.motilaloswal.com/MOSLdisclaimer/disclaimer.html
SEBI Registration number is INH000000412


More News

Defence & Aerospace Sector Update : Revenue softness due to execution timing, but margin & e...