

Commodity Weekly Report 29th June 2026 by Choice Broking Ltd

Gold
Comex Gold settled below $4,100 per ounce on Friday, posting a second straight daily gain after the latest US PCE inflation data matched market expectations, easing fears of stronger inflationary pressures. However, the precious metal still declined around 3% for the week, marking its fourth consecutive weekly loss, as stronger US yields, a firmer dollar, fading safe-haven demand, delayed Fed rate-cut expectations, profit-booking after a sharp rally. ETF outflows, and portfolio rebalancing amid tech market weakness weighed on bullion prices. Fed Chair Kevin Warsh reiterated the central bank's commitment to controlling inflation despite political pressure for rate cuts. Markets are currently pricing in three Fed rate hikes in 2026, with a 62% probability of the first hike in September. Investors will closely monitor the upcoming US June jobs report, JOLTS, ADP employment. ISM Manufacturing PMI. factory orders, and Eurozone inflation data for further policy direction.
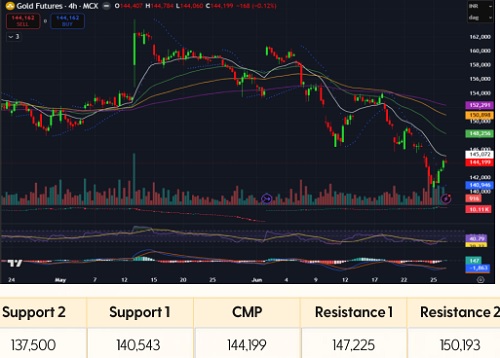
Gold price has posted a weaker closing for the 3rd consecutive week, where price has rebounded from dips and managed to settle on Friday at 144,199. In past week momentum. price has formed a Bearish Spinning top weekly candle suggesting a indecision among traders. Here, we can observe that price has failed to breakthrough the support of 200-DEMA level placed at 140,731 and rebounded marginally. Key hurdles would be at Daily SAR and 50-DEMA level which are placed at 147,225 and 152,028 respectively. The momentum indicator, RSI remained below 50 level on Daily as well as Weekly chart. On 4-hourly MACD, we can observe a bullish crossover below zero-line alongside the emergence of positive histograms. Dollar Index has reversed from the peak of 101.51 and retraced to 10108.
The overall trend in Gold price is expected to be Moderately Bullish in the coming week, and traders should keep an eye on key US economic data such as Manufacturing PMls, and employment data such as Avg hourly earnings, NFP, Unemployment rate and Unemployment claims which are scheduled to be release in next week.
Silver
Comex Silver settled above $58 per ounce on Friday but ended the week nearly 10% lower, marking its second consecutive weekly decline. Prices remained under pressure from a stronger US dollar, higher real Treasury yields, and the Federal Reserve's hawkish policy outlook. The Fed raised its 2026 PCE inflation projections, while May headline PCE inflation accelerated to 4.1%, reinforcing expectations of three Fed rate hikes in 2026 with a 62% probability of the first increase in September. Investors also reduced bullion holdings to offset losses in technology stocks. Additionally, a widening 14-month high US goods trade deficit and weaker global growth sentiment weighed on silver, which remains more vulnerable due to its significant industrial demand.
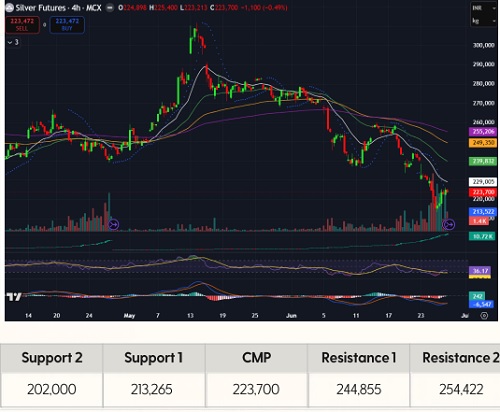
Silver price has continued to decline for the 5th consecutive week, posted a decline of -6.31% in past week and closed at 223,700. Price has sustained over 50-EMA on Weekly chart placed at 215,288. Silver price has remained in a bearish trend and remained below all key moving averages i.e. 50, 100 and 200-DEMA levels placed at 254222, 251549 and 227882 respectively. In previous week, price has rebounded marginally from the low of 213,265. Daily SAR is placed at 251,840. Since the expiry is nearby in July contract, we can observe a rise in Ol level to 10,720 lots in September expiry. RSI levels remained below 45 on Daily and Weekly chart. Also. we can observe a bullish crossover below zero-line in 4-hourly MACD along with declining negative histograms
We are expecting Moderately bullish trend in Silver and traders should look for the breakout of immediate resistance level for the long opportunity.
Crude Oil
WTI Crude Oil prices fell to nearly $69 per barrel on Friday, the lowest level since February 27, and recorded a weekly decline of more than 10%, the sharpest drop in a month. Prices came under pressure as shipping activity through the Strait of Hormuz accelerated following progress in US-Iran peace negotiations, restoring Persian Gulf exports to around 75% of pre-war levels. Saudi Arabia Restarts Crude Loadings at Major Gulf Terminal After Nearly Four-Month Halt, while the UAE, Kuwait, and Qatar increased crude supply despite tanker shortages. Iraq also sought a higher OPEC production quota to recover wartime losses. However, concerns persisted after President Donald Trump accused Iran of violating the ceasefire by targeting cargo ships, while a vessel struck off Oman highlighted ongoing security risks and uncertainty over regional oil flows.
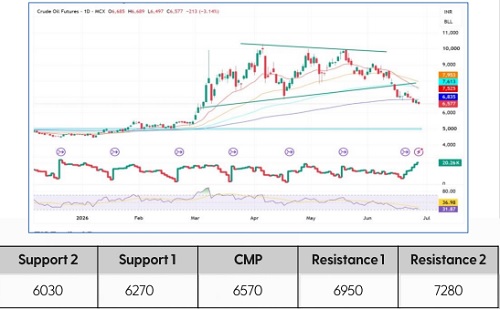
MCX Crude Oil Futures continued their bearish trajectory for the third consecutive week, closing around 6570, below all key daily moving averages, with the 20-50-100-200 DEMA placed at 8045, 7716, 7591 and 6946 respectively. The negative alignment of these moving averages highlights a firmly established downtrend across both short-term and long-term timeframes. The recent breakdown below the key support zone near the 200 DEMA further confirms deterioration in the overall price structure, while lower highs and lower lows continue to reinforce the prevailing bearish trend. Open Interest has increased by nearly 8,000 lots alongside the sharp decline in prices, indicating fresh short build-up and growing participation from sellers. On the technical indicator front, RSI is hovering near 32, remaining below its moving average and approaching the oversold region, which reflects weak momentum despite the possibility of intermittent pullback rallies. However, given Crude Oil's sensitivity to global developments, traders should closely monitor geopolitical events, OPEC+ policy decisions, and supply-related news, as these factors could trigger short-term volatility.
Overall, the technical structure remains moderately bearish, and traders should adopt a "sell on rise" approach rather than chasing prices at lower levels. Any recovery towards key resistance zones may provide fresh selling opportunities, while sustained trade below the major moving averages is likely to keep downside pressure intact in the near term
Natural Gas
NYMEX Natural Gas prices settled around $3.27 per MMBtu this week, supported by stronger LNG export demand and forecasts of warmer-than-normal weather through July 10, boosting electricity demand for cooling. Average daily feedgas deliveries to major US LNG export terminals increased to 17.3 bcf in June from 17.1 bcf in May, driven by record flows to the Golden Pass LNG facility in Texas. The EIA reported a 76 bcf storage injection for the week ended June 19, leaving inventories 5.7% above seasonal averages, while Lower 48 production remained steady at 109.7 bcf per day. Although northwest Europe's heatwave is expected to ease, European gas storage remains just 47% full. Meanwhile, improving shipping through the Strait of Hormuz and Qatar's plans to restore LNG production supported supply, though a cargo ship attack near Oman highlighted ongoing geopolitical risks.
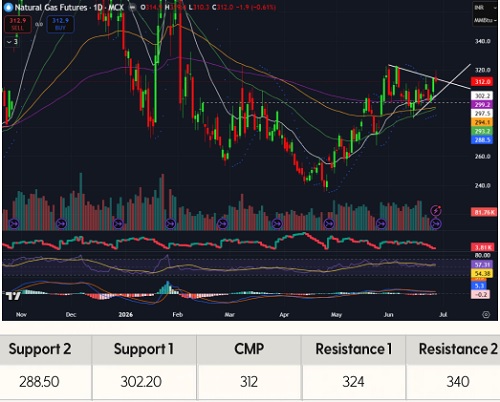
MCX Natural gas July contract has resumed on a positive note with gapped up at 316, made a dip at 302.20, rebounded marginally and managed to settle at 312. Price has continued to trade over all key moving averages ie, 50, 100 and 200-DEMA levels placed at 293.20, 294.10 and 299.20 respectively. Here, we can observe a Symmetric triangle formation and price has failed to breakthrough the resistance-line on Friday. Daily SAR is also placed at 288.50. immediate resistance would be at 324 and breakout of this level will accelerate upward momentum in Natural gas price. RSI levels remained over 50 level on Daily, Weekly and Monthly timeframes. Also, we can observe a bullish crossover below zero-line on Weekly MACD along with positive histograms.
We are expecting Sideways-to-bullish trend in Natural gas in upcoming week and traders may look for buy-on-dips opportunity.
Copper
LME Copper futures declined this week as a stronger US dollar and the Federal Reserve's hawkish policy outlook weighed on industrial metals. The Fed kept interest rates unchanged but signaled growing support for future rate hikes, while Fed Chair Kevin Warsh reiterated the central bank's commitment to restoring price stability. Higher interest rate expectations and a firmer dollar reduced the appeal of dollar-denominated commodities and raised concerns over global industrial demand. Meanwhile, SFHE copper inventories fell 5.7% to 135,732 tonnes, the lowest since December, while LME stocks declined to 336,475 tonnes, the lowest since March 18. China's industrial profits rose 18.8% year-on-year during January-May, with upcoming official and Caixin PMI data expected to provide further demand signals.
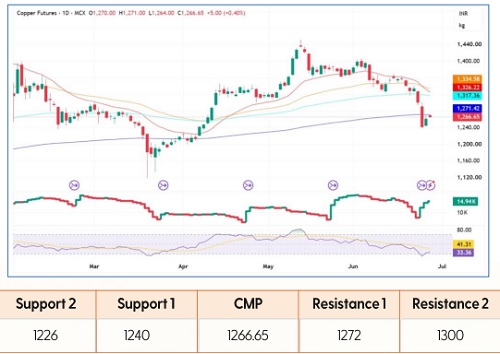
MCX Copper Futures remained under sustained selling pressure for the fifth consecutive week, with prices declining nearly 7% and closing the week around 1266.65, below all key daily moving averages, with the 20-50-100-200 DEMA placed at 1334.60, 1326.20, 1317.40 and 1271.40 respectively. The negative alignment of these moving averages reflects a weakening trend across both short-term and medium-term timeframes. Open Interest has increased by nearly 7,080 lots while prices declined, indicating fresh short build-up in the contract. The simultaneous rise in Open Interest and fall in prices suggests increased participation from sellers, reinforcing the prevailing negative sentiment. On the technical indicator front, RSI is hovering near 33, remaining below its moving average and approaching the oversold zone. reflecting weak momentum despite the possibility of short-covering rallies.
Overall, structure remains moderately bearish, and traders should adopt a cautious approach. Any recovery towards key resistance levels may offer fresh selling opportunities, while sustained trade below the major moving averages is likely to keep downside pressure intact in the near term.
Zinc
LME Zinc futures ended the week lower as a stronger US dollar and expectations of higher US interest rates reduced the appeal of dollar-denominated commodities for overseas buyers. Losses were partly limited by progress in US-Iran peace talks, which eased concerns over global economic disruptions and improved the outlook for industrial metals demand. However, prices also found support from tightening global supply conditions. Glencore's Kazzinc facility in Kazakhstan continues to operate at reduced rates following an explosion, while Nexa's Cajamarquilla smelter in Peru is still recovering from fire-related damage. In addition, a seismic event at Boliden's Garpenberg mine has raised concerns over prolonged production disruptions. Reflecting the tight market, the International Lead and Zinc Study Group (ILZSG) forecasts a refined zinc deficit of 19,000 tonnes in 2026.
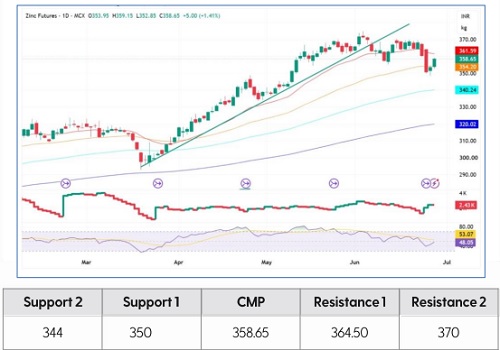
MCX Zinc Futures witnessed a weak start to the week as prices came under selling pressure, followed by a recovery in the latter half driven by short covering and value buying Despite the rebound, Zinc closed the week at 358.65, trading below the 20 DEMA at 36160, while continuing to hold above the 50-100-200 DEMA, placed at 354.20. 340.25 and 320.00 respectively. This indicates that although short-term momentum remains under pressure, the broader medium-term trend is still constructive as long as prices sustain above the key support levels. Open Interest currently stands at around 2,430 lots, suggesting relatively stable participation. On the technical indicator front, RSI has started to recover from lower levels and is placed near 48, indicating improving momentum after emerging from a weak phase.
Overall, the technical structure remains neutral to mildly bullish. We may expect a reversal from the recent lows as long as prices hold above the crucial support zone around 350. However, a decisive breakout above 362-364.50 could trigger fresh buying momentum, while a breakdown below 350 may revive selling pressure and lead to further downside.
For Detailed Report With Disclaimer Visit. https://choicebroking.in/disclaimer
SEBI Registration no.: INZ 000160131


_Securities_(600x400).jpg)
