

Commodity Weekly Report 20th Jun 2026 by Choice Broking

Gold
COMEX Gold prices fell below $4,200 per ounce this week, erasing earlier gains as a stronger US dollar and growing expectations of tighter Federal Reserve policy pressured investor sentiment. The dollar strengthened to a one-year high after the Fed kept interest rates unchanged while signaling a more hawkish stance, with nine policymakers now projecting at least one rate hike later this year. Improved shipping conditions through the Strait of Hormuz following the US-Iran interim peace agreement reduced safe-haven demand. Meanwhile, Swiss gold exports declined 9% in May amid weaker shipments to India and Hong Kong. Global gold ETF holdings continued to shrink, recording an eighth consecutive day of outflows. Geopolitical tensions eased further as Israel and Hezbollah agreed to a ceasefire, while Iran signaled plans for renewed talks with US officials. Investors now await key US economic data, including PCE inflation, personal income and spending figures, and durable goods orders, for further direction.
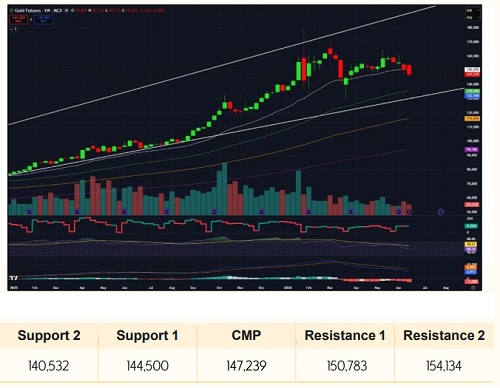
Gold price has experienced profit-booking for the 2nd consecutive week, posted decline of -2.28% in past week and settled on a negative note at 147,239. Looking at overall momentum, price has declined by more than 5% so far in June and started trading below 50 and 100-DEMA levels placed at 153686 and 150783 respectively. Here, price has formed a Doji candle at its pprevious support area post Friday's momentum. Daily SAR is also placed at 154,134 which will be major resistance to look for, Immediate support would be at 200-DEMA level placed at 140,532 and breakout of this mark will accelerate downside momentum in Gold price in upcoming week. Daily RSI has been fallen below 40 level. Also, we can observe a convergence on Monthly MACD alongside declining positive histogram.
The overall trend in Gold price is expected to be Moderately Bearish in the coming week, and traders should keep an eye on key US economic data such as PCE Price index, Final GDP, Consumer sentiments and Unemployment rate which are scheduled to be in next week.
Silver
COMEX Silver prices fell around 1.4% over the week as a stronger US dollar and expectations of higher-for-longer US interest rates weakened demand for non-yielding precious metals. The dollar hit a one-year high after the Federal Reserve kept rates unchanged but adopted a hawkish tone. Geopolitical uncertainty also persisted after planned US-Iran talks were postponed. Meanwhile, India's silver imports also dropped sharply in May. Silver inventories at major trading hubs have declined sharply from pandemic-era peaks, reflecting a sustained drawdown in visible stocks.
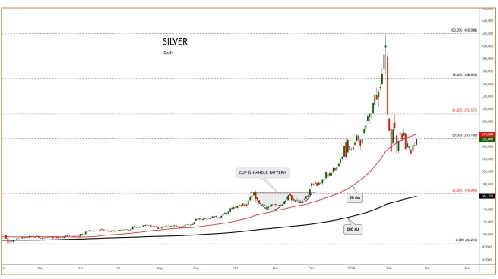
MCX Silver prices witnessed sharp selling pressure over the week, declining around -8% and touching a low of 228162 before closing the week at 232736. Prices are trading below the key short-term moving averages 20-50-100 DEMA placed at 251,261, 252,690 and 256,095 respectively, while managing to hold above the crucial 200 DEMA support placed at 231,610, indicating that the broader long-term structure remains intact despite near-term weakness. Open Interest (OI) remained relatively stable around 10,690 lots, indicating a consolidation phase after the recent decline rather than aggressive fresh short build-up. Momentum indicators remain weak, with RSI hovering near 35.17 below its average of 41.34, suggesting bearish momentum and a lack of strong buying interest at current levels. The Gold/Silver ratio (also known as the Mint Ratio) is currently hovering around 64:1. A sustained breakout above 65.90 may lead the ratio towards the 67.20 zone, indicating relative underperformance of silver compared with gold.
Overall, MCX Silver remains in a moderately bearish trend in the short term. However, the strong support around the 200 DEMA zone near 231,610 may restrict further downside. Traders should remain cautious and watch for sustained price action above short-term resistance levels before expecting a meaningful recovery.
Crude oil
WTI crude oil fell below $80 per barrel on Friday and headed for a weekly loss of about 8% after Israel and Hezbollah agreed to a ceasefire. The truce, if sustained, could support wider US-Iran peace efforts and ease supply fears. However, Tehran said vessels crossing the Strait of Hormuz will require mandatory insurance, reinforcing its control over the route. Shipping activity slowed after an earlier spike, though nearly 10 million barrels were seen near the strait. Iranian output will likely refill Chinese oil stockpiles, which were depleted in the last months as the world's largest importer refrained from purchasing oil to prop up prices further. The added supply is due to replenish refineries across the globe with the higher export quotas from OPEC+ stronger Gulf output, and potential sanctions relief for Iran continued to pressure prices throughout the week.
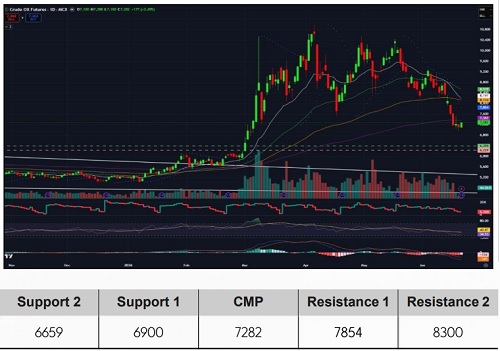
Crude oil price is heading towards the weaker closing for the second consecutive month, declined by more than -12% so far in June. Price has been rebounded marginally from the support low of 6928 and managed to settle at 7282, posted overall weekly decline of -10%. Price has broken through the neckline support of Double top formation, which was placed at 7743 in line chart and continued to trade below its all key moving averages i.e. 50, 100 and 200-DEMA levels placed at 8539, 8134 and 7363 respectively. Daily SAR also placed upside at 7854. Major support is to be considered at 100-EMA on the weekly timeframe, which is placed at 6659, and a breakout of this level will boost the downside momentum in Crude oil in the upcoming Week. The momentum indicator, RSI remained below 50 level on Daily as well as Weekly chart. Also, we can observe a bearish crossover on Weekly MACD above zero-line alongside negative histograms, suggesting an overall bearish bias in Crude oil.
We are expecting continuation of downtrend in Crude oil price if price fails to sustain over immediate support levels and traders should look for Sell-on-rise oppotunity.
NATURAL GAS
NYMEX Natural Gas prices ended the week about 2% higher as expectations for a rapid recovery in Middle East energy supplies weakened. Although Israel and Hezbollah reached a ceasefire and Iran signaled plans to resume talks with US officials, uncertainty remained after scheduled negotiations were postponed. Shipping data showed no outbound tanker movements from the Persian Gulf on Friday, dampening confidence in an immediate normalization of energy flows. However, gains were capped by expectations of increased LNG supply from Qatar, which plans to quickly restore production and exports. Additional support came from forecasts of hotter weather across Europe, boosting cooling demand Meanwhile, European gas storage levels remained relatively low at 45.56%, compared with 54.38% a year ago and below the five-year average, supporting near-term price sentiment.
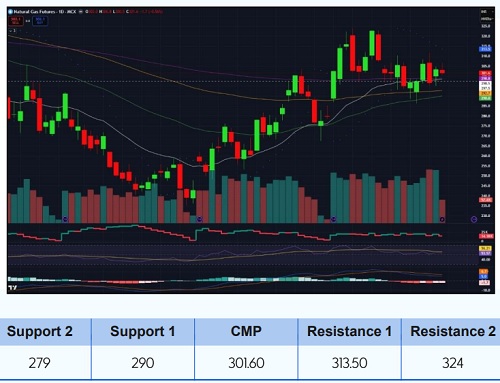
Natural gas prices have resumed on a flat note this past week at 292.20, marking a support low at 286.20 on Monday and rebounded marginally over the course of the week and closed at 301.60. Looking at the past couple of days' momentum, we can observe that price has remained in the tight range of 297 to 305 on the closing basis on Intraday momentum and continued to sustain over its all key moving averages i.e. 50, 100 and 200-DEMA levels placed at 290, 292.70 and 298.80 respectively. Daily SAR placed on the opposite side at 313.50, to be considered as a Major resistance level and if price manages to break through this level, we may expect more upward momentum in Natural gas price towards its next hurdle at 324. RSI levels remained around 50 on Daily, Weekly as weel as monthly timeframes. On Weekly MACD, there is a bullish crossover below the zero-line alongside positive histograms. We are expecting Sideways-to--Bullish trend in Natural gas price and traders should look for the breakout over immediate key levels for the trading opportunity.
Copper
LME Copper futures ended the week lower as the market sentiment pressured by the interim US-Iran peace agreement, which is expected to facilitate the reopening of the Strait of Hormuz and ease supply-chain risks. On the supply side, Rio Tinto resumed copper concentrate exports from its Oyu Tolgoi mine in Mongolia following a brief disruption. espite the bearish sentiment, copper inventories continued to tighten, with LME stocks at a three-month low and Shanghai inventories falling sharply. The US Federal Reserve kept interest rates unchanged but signaled a greater likelihood of rate hikes later this year, raising concerns over global economic growth and industrial metals demand However, Market participants are also closely monitoring China's upcoming Loan Prime Rate decision for signals on economic support measures.
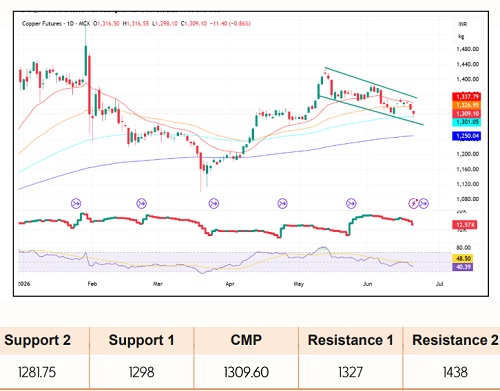
MCX Copper prices continued their bearish momentum, declining over -3% during the week and marking the fourth consecutive weekly loss. Prices closed the week at 1309.10, trading below the key short-term resistance levels of 20-DEMA and 50-DEMA placed at 1337.79 and 1326.95 respectively, while still holding above the longer-term 100-DEMA and 200-DEMA at 1301.05 and 1250.04. Open Interest (OI) witnessed a sharp decline of around -3,730 lots during the week along with falling prices, indicating long liquidation and weakening bullish participation. Technical indicators suggest a cautious outlook, as prices are trading within a downward-sloping channel and remain under pressure below the short-term moving averages. RSI is placed around 40.39, below its signal line at 48.50, indicating weakening momentum and a bearish bias.
Overall, MCX Copper prices remain under short-term pressure, and traders should remain cautious around immediate support zones. A sustained move above the 20-DEMA and the upper channel resistance may be required to signal a reversal in the current bearish trend.
Aluminium
LME Aluminum futures declined around 4% during the week as an interim US-Iran peace agreement eased concerns over supply disruptions. The deal is expected to reopen the Strait of Hormuz, allowing aluminum exports from the Persian Gulf, a region accounting for nearly 9% of global production, to resume. Prices were further pressured by rising aluminum output in China and increasing supply from Indonesian smelters. Weak Chinese economic data also raised concerns over demand prospects. Additionally, the Federal Reserve's hawkish stance strengthened the US dollar, weighing on metal prices. China's aluminum production rose 1.7% year-on-year in May, while exports of unwrought aluminum and related products recorded strong growth, highlighting ample global supply conditions.
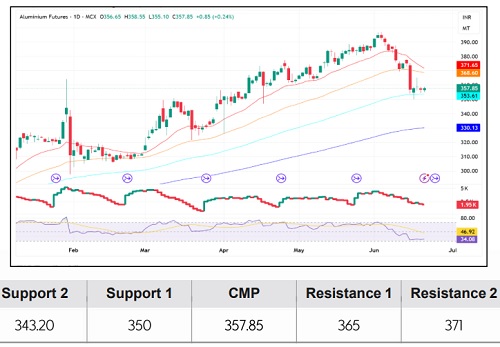
MCX Aluminium prices witnessed sharp selling pressure at the beginning of the week, declining over 5.5%, followed by a phase of consolidation during the latter half of the week. The week closed at 357.85, below the 20-50 DEMA placed at 371.65 and 368.60 respectively, signalling near-term bearish momentum. However, Aluminium continues to hold above the 100-200 DEMA placed at 353.61 and 330.13 respectively, suggesting that the broader medium-to-long-term structure remains supportive. Open Interest has declined by around 470 lots, indicating profit booking and long liquidation during the recent correction rather than aggressive fresh selling. On the indicator front, RSI is placed around 34.08, approaching the oversold zone, reflecting weak short-term momentum. RSI Moving Average is around 46.92, remaining above the RSI, which indicates continued bearish pressure and loss of momentum. Momentum indicators suggest that prices may remain under pressure until a strong reversal signal emerges.
Overall, MCX Aluminium remains in a short-term corrective phase within a broader positive structure. Traders should closely watch the 353-365 zone, as sustaining above this support region may help prices stabilize, while a strong and decisive breakout above 365 would be required to improve the near-term sentiment and signal fresh upward momentum.
For Detailed Report With Disclaimer Visit. https://choicebroking.in/disclaimer
SEBI Registration no.: INZ 000160131


_Securities_(600x400).jpg)
