Commodity Weekly Report 10th Nov 2025 by Choice Broking

Gold

Gold prices traded back & forth, with spot gold closed right above $4000. This momentum was driven by a weakerU.S. dollar and ongoing concerns related to the government shutdown, which has now lasted 38 days. Theuncertainty created by the delayed U.S. non-farm payrolls report, a consequence of this political impasse, has fueleddemand for gold as a safe haven, particularly in light of recent private sector data indicating job losses in October.Market participants are currently assigning a 66% probability of a rate cut in December, as reported by CMEGroup’s FedWatch Tool. This dovish market sentiment, along with declining Treasury yields, is providing supportfor gold amidst a backdrop of general risk aversion.
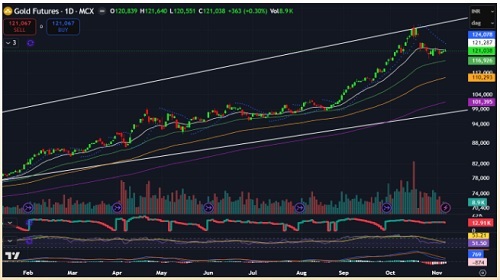
Gold price has experienced another week of profit-booking from its peak levels, made a mild decline in past week asprice was traded back & forth and managed to settle at 121,038. On Daily chart, price has still traded in Risingchannel howeverprice has remained below 20-DEMA level placed at 121,287. Key supports would be at 50 and100-DEMA levels placed at 116926 and 110293 respectively. On the other hand, key resistance would be at DailySAR level placed at 124,078. The momentum indicator, RSI remained above 50 level on Daily and Weekly chart.Also, we can observe a convergence on MACD along side declining negative histograms on Daily time-frame whichsuggests positive biasness in gold price.The overall trend in Gold price is expected to be Moderately Bullish in the coming week, and traders shouldkeep an eye on key US economic data such as Inflation, PPI, Retail Sales data which are scheduled to be releasein next week.
Silver
Silver has recently eased roughly 13.5%, slipping from over $54 to just below $47 an ounce. While this pullbackshould have considered as as market fatigue, we can call it a healthy bull-market digestion—a brief pause precedingthe next explosive surge. This isn’t the end of the move but It’s the reset before the next acceleration.
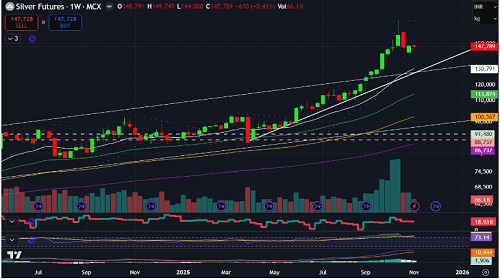
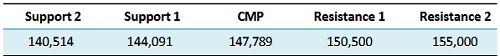
Like Gold, Comex Silver has traded back & forth over the course of the week, settled on a negative note at $$48.32 /ounce in past week, having a minor fall of -0.68%. In past week, price has found support over $46.88. Looking atMCX Silver December contract, we can observe that Silver price has traded in a tight range between 144,000 to148,000 in past week, hovered around 20-DEMA level placed at 147,437. Here, price is still above its all keymoving averages i.e 50, 100 and200-DEMA levels placed at 140514, 129806 and 117240 respectively. Daily SARis also placed at 139,501. Immediate resistance would be at 150,500 and breakout of this level will increasedvolumes will accelerate upward momentum in Silver price in upcoming sessions. Looking at momentum indicators,RSI levels remains over 50 level on Daily chart. Also, we can observe a convergence on MACD along side decliningnegative histograms.
The Gold–Silver Ratio which is also known as Mint ratio, has continued to decline after recent pullback and settledat 82.80. This continuation in Fall is favorable for Silver price in upcoming sessions.
Overall, the trend in Silver remains sideways to bullish, with expectations of continued stabilization and potentialupside in the near term. Traders should look for buy-on-dips opportunities while monitoring volatility andmomentum indicators for sustained strength.
Copper
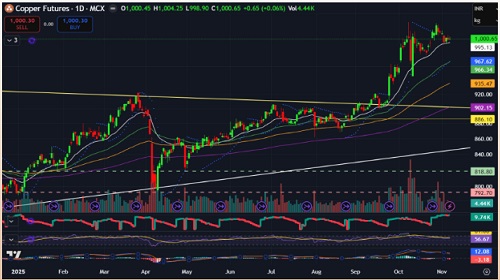
The Copper price has recently fallen significantly from its record high at the end of October of just over $11,000 per ton. Copper imports slid to 438,000 metric tons in October from 485,000 tons a month earlier, a 9.7% drop, according to data from the General Administration of Customs. For the year through October, China imported 4.46 million tons of copper, down from 4.60 million tons during the corresponding period last year. Overall, imports this year are still around 7% above last year's level. At the same time, the continued subdued imports of unwrought Copper and Copper products indicate that there is limited demand for Copper beyond domestic production.
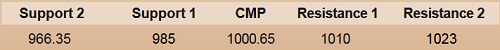
MCX Copper November contract has paused its upward momentum in past week, posted a fall of -1% andmanaged to settle on a negative note at 1000.65. Price has traded back & forth in a tight range of 995 to1005 in past week. Copper price has continued to traded over its all key moving averages i.e, 20, 50 and 100-DEMA levels placed at 995.15, 966.35 and 935.50 respectively. Daily SAR is currently placed at 967.60.Crucial resistance level would be at 1023 and breakout of this level will accelerate upside momentum inBullish trend in Copper price.
Looking at OI levels, we can observe a significant long buildup to 9740 lots with recent price-consolidationwhich eliminates any chances of trend reversal in Copper price. RSI levels are hovering over 55 levels onDaily as well as Weekly chart. Also, we can observe a convergence on MACD below zero-line along sidedeclining negative histograms on 4-hourly chart. These collectively suggests a bullish biasness in CopperWe are expecting Sideways to Bullish trend in next week in Copper and traders may look for Buy-on-dipsopportunity.
Crude Oil
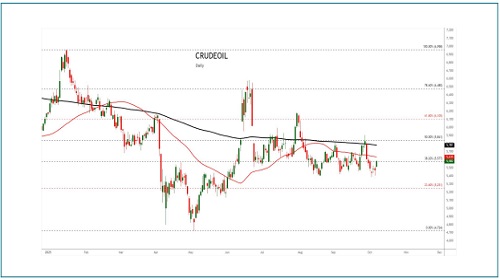
Crude Oil prices fell by 4.3% during the week, continuing under sustained bearish pressure as prices failed tohold higher levels and reversed sharply. US Oil, after registering a previous week low of $58.83, closed theweek marginally higher at $59.83 but remains below all respective daily and weekly EMA benchmarks. Thisreflects considerable weakness and underscores the inability of bulls to regain control in the near term
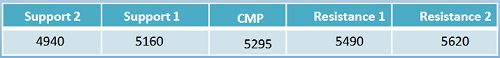
MCX Crude Oil November contract traded under apronounced bearish cloud, confirming a breakdown outof a double top pattern observed on the daily chart. The the week close at 5,295, decisively below all majormoving averages 20, 50, 100, and 200 DEMA positioned at 5,343, 5,412, 5,454, and 5,489, respectively.Open Interest (OI) saw a notable decline of around 4,000 lots week-on-week, demonstrating reduced marketparticipation and further validating the bearish sentiment. Immediate supports for MCX Crude Oil are seen at5,160 and 4,940, zones that could temporarily halt declines or invite limited bargain buying. Resistance isfound at 5,490 and 5,620, levels that align with higher moving averages and will pose significant barriersshould prices attempt recovery. The daily Relative Strength Index (RSI) ended at 45.99, with a movingaverage at 48.28, both depicting a neutral-to-bearish momentum below the key 50 level. MACD actionremains firmly negative, with no bullish crossover, reflecting persistent negative price momentum. Tradingvolumes continued to reduce, in sync with the open interest contraction to 11390 , consolidating theprevailing risk-off sentiment among market participants.
The short-to-medium term outlook for crude oil remains bearish, with prices likely to struggle againstoverhead resistances unless there is a decisive shift in macro or demand trends. Traders are advised toexercise caution and prefer selling on rallies while closely monitoring price activity around the 5,160–4,940support zone for potential short-covering or relief bounces.
Natural Gas
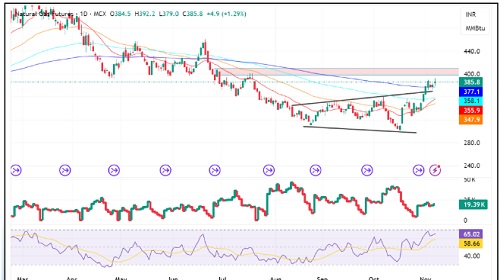
Natural Gas prices posted a robust +7% gain over the past week, continuing a bullish run for the thirdconsecutive week, fueled by strong demand and supportive global cues. NYMEX Natural Gas extended itswinning streak with prices forming a classic "three white soldiers" pattern on the weekly timeframe,signaling sustained bullish momentum. The contract ended the week at $4400.4, marking a significant close,with immediate supports identified at $4235 and $3975.5—levels likely to attract buying interest on anypullbacks.
MCX Natural Gas prices spent much of the mid-week consolidating sideways after an earlier bull surge,hitting a new high at 392.2 before settling at 385.8. Importantly, this close remains above the 20, 50, 100,
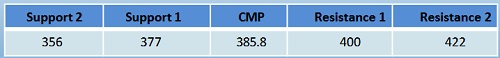
and 200 DEMA levels, which are situated at 348, 356, 358, and 377 respectively, underscoring the prevailingbullish structure. The November contract exhibited notable volatility in Open Interest (OI); positions weresquared off at the week's start, but a renewed surge of +2000 lots in OI mid-week reflects fresh participantentry and growing market confidence. Immediate supports for MCX Natural Gas are observed at 377 and356, aligning with key moving averages, while resistance is pegged at 400 and 422, with the latter coincidingwith the 100-weekly EMA, which is a critical barrier for further advances. On the daily chart, the RSI standsstrong at 65.02, signaling a continued bullish bias and showing momentum comfortably above the neutral50-mark. The MACD is firmly in bullish territory, maintaining a positive crossover and supporting the thesisof sustained upward movement. Volume data corroborates this bullish stance, with rising turnoverconfirming increased market participation and renewed momentum
The short-to-medium term trend for Natural Gas remains moderately bullish, supported by persistent buyinginterest, healthy open interest trends, and indicators suggesting positive momentum. Traders are advised tofollow a buy-on-dips strategy, particularly while monitoring the 400-422 resistance zone for signs ofsustained momentum or potential further rallies if these hurdles are overcome.
For Detailed Report With Disclaimer Visit. https://choicebroking.in/disclaimer
SEBI Registration no.: INZ 000160131