Chana Report 25th Sept 2025 by Amit Gupta, Kedia Advisory
Past Performance
Supply Tightness Amid Import Pressure: Despite imports rising over 800% YoY, private stock depletion and reduced arrivals have tightened supply, supporting prices.
Production and Demand Outlook: Chana production for 2024-25 stands at 113.37 lakh tonnes, but remains 5.3% below the five-year average, while annual demand estimates near 7.3 lakh tonnes provide strong support.
MSP vs Market Price Gap: Current prices remain below MSP of Rs.5650/quintal, indicating limited downside risk and potential for government intervention.
Global & Policy Risks: Yellow pea duty-free import till March 2026 and Australia's 2-2.5 million tonnes output pose risks to price stability.
Technical Support Emerging: RSI recovery, MACD bullish crossover, and Vortex indicator strength suggest trend reversal and potential price rebound toward Rs.6100 by August.
Price Outlook:
Price - 5631.25
Trend - Recovering
1-2 Months - Rs.5800–Rs.6100 likely amid tight supply and festive demand
3 Months - Rs.6250 possible if import pressure eases and MSP support holds
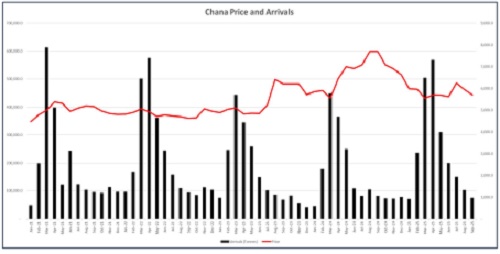
Price Performance: Chana prices surged over 10% in one month to Rs.6,200, driven by tight supply, rising demand, and strong exports.
Supply vs Demand Dynamics: March–July 2025 arrivals surged 37.75% YoY to 17.12 LMT. Chana output at 113.37 LMT, only 5.30% below 5-year average. Demand shifts toward tur, moong may limit price strength.
Import & Policy Risk: May 2025 imports rose 32% MoM to 18,944 tonnes; FY25 imports jumped 800% to 16.13 LMT. Duty-free yellow pea import extension till March 2026 pressures domestic chana price outlook.
Seasonal Factors & Export Boost: Apr–May 2025 exports up 41% YoY at 55,708 tonnes; FY25 exports rose 86% to 1.15 LMT. Better July monsoon could improve Rabi crop, capping festive season price gains.
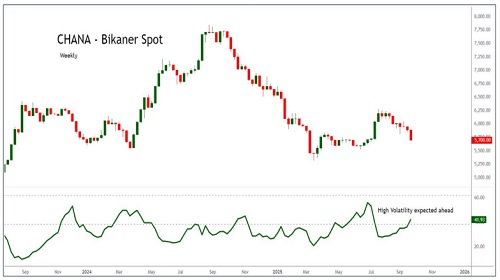
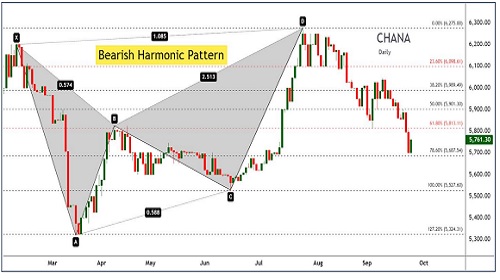
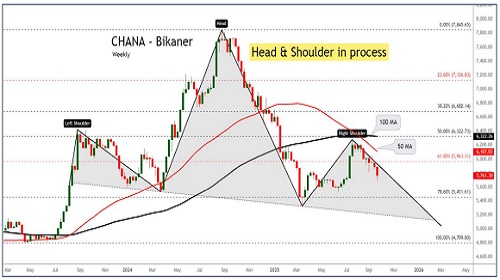
Bearish Pattern Signals Reversal Risk: A Bearish Harmonic Pattern has emerged near Rs.6275, indicating trend exhaustion. Prices have faced resistance at the pattern completion zone with signs of correction ahead.
Technical Indicators Turning Cautious: RSI has dropped from 76.54, exiting the overbought zone. MACD remains elevated but may converge. Vortex shows early weakness, and the Choppiness Index at 14.91 confirms high volatility with a risk of trend reversal.
Price Outlook:
Price - 6200.00
Trend - Turning Bearish
1-2 Months - 6000–6050 likely as bearish pattern and profit-booking weigh in
3 Months - 5800-5850 possible if global supply pressure and technical correction persist
Price Performance: Chana slipped over 4% in July–Aug 2025 to near Rs.6,000, after a bearish harmonic pattern triggered reversal pressure around Rs.6,300–6,400.
Supply–Demand Balance: Arrivals rose 35.85% YoY to 18.15 LMT, while private stocks fell 70–75%, but substitution into tur, moong and urad capped upside
Imports & Policy Risks: Duty-free yellow pea import extension till March 2026, coupled with FY25 imports jumping 800% to 16.13 LMT, continued to pressure chana prices.
Exports & Festive Support: Apr–Jun 2025 exports rose 124% to 25.7 LMT. Festive demand may aid sentiment, though global easing in pulses and NAFED release remain threats.
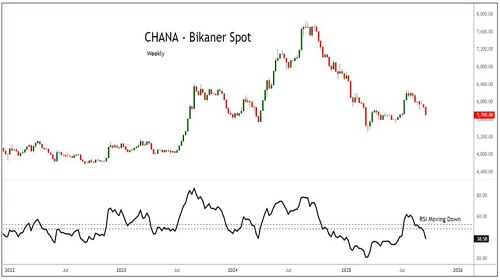
Technicals: RSI weakening at 49.10, MACD neutral, Vortex shows bullish exhaustion. Prices below 200 MA with an Head & Shoulders neckline risk further downside.
Price Outlook:
Price - 5950.00
Trend - Turning Bearish
1-2 Months - 5800-5750 likely as bearish pattern and profit-booking weigh in
3 Months - 5600-5500 possible if global supply pressure and technical correction persist
Strengths
* Private traders’ stock reduced by 70-75%, tightening market supply.
* Rising demand estimated at 7.3 lakh tonnes annually supports price strength.
* For Apr – Jul 2025, exports rose by 105% to 32,658 tonnes tonnes compared to last year.
* Canadian exports were strong in the 2024/25 season due to higher demand from the EU and Pakistan.
* WPI Inflation for Gram down by 9.10% in Aug 2025 compared to Aug 2024.
* Agriculture Minister Shivraj Singh Chouhan approved procurement of major Kharif pulses from Uttar Pradesh and Gujarat this year.
Weaknesses
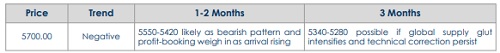
* Chana prices dropped over 4% in a month to 5700 level continuing its bearish trend as expected in last report.
* For Mar to Sep 25, 2025, 19.13 LMT arrivals arrived up by 34.31% compared to last year.
* The duty-free import policy for yellow peas has been extended until March 31, 2026, releasing pressure from Chana
* The procurement of gram for RMS 2023-24 is 23.53 LMT, down by 7.94% compared to 25.56 LMT in 2022-23
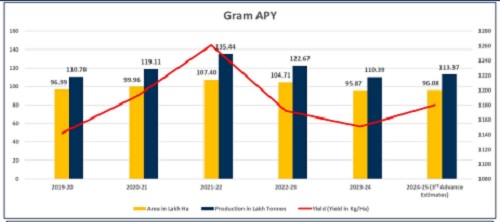
* As per 3rd Advance Estimates, Chana production for 2024-25 at 113.37 lakh tonnes, up by 2.70% from 2023-24.
* Australia exported 24,951 tonnes chickpeas, down 41 percent from the 42,629t shipped in June.
Opportunities
* Chana production for 2024-25 expected at 113.37 lakh tonnes, down by 5.30% compared to last 5 year average of 119.68 lakh tonnes.
* Halting of yellow pea imports can drive domestic chana demand sharply upwards.
* Poor global pulse prices or supply chain issues can temporarily favor domestic prices.
* Festive demand ahead may further accelerate price movement.
* Approximately 23.5mln tons of chickpea exports expected from Canada during the 2025-26 (August-July) could be a new record.
* As per weekly chart, price maintaining above the 200-week moving average, indicating prices can get support.
Threats
* The crop of desi chickpeas in Australia is expected to be 2-2.5 million tonnes
* Consumption shifts toward cheaper pulses like tur, moong and urad.
* Global pulse prices are easing, posing competition for Indian exports and domestic market
* Any sudden NAFED stock release can cool prices sharply within weeks.
* In addition, new yellow pea supplies from Russia and later Canada (Oct–Nov) may add more pressure.
* Canadian chickpea carry-over stocks are expected to be twice as high as in the previous year, which will greatly increase overall availability.
* Agriculture and Agri-Food Canada (AAFC) expects a production of 315,000 mt for the 2025/26 Canadian chickpea crop, up by 9.8% from 2024/25.
Volatility
The Choppiness Index is a technical indicator that quantifies whether a market is trending or moving sideways. It ranges from 0 to 100, with higher values indicating a choppy, range-bound market, while lower values suggest a strong trending condition. A reading above 61.8 signals consolidation, whereas below 38.2 indicates a strong trend. Traders use it to adjust strategies for breakout or range-bound trading
RSI
Relative Strength Index (RSI) is a momentum oscillator that measures the speed and change of price movements, ranging from 0 to 100. Values above 70 indicate overbought conditions, while below 30 suggest oversold levels, helping traders identify potential trend reversals.

Moving Averages
A Moving Average (MA) in technical analysis is a trend-following indicator that smooths price data by calculating the average price over a specific period. It helps traders identify trends, support, and resistance levels. Common types include the Simple Moving Average (SMA) and Exponential Moving Average (EMA), with shorter periods reacting faster to price changes and longer periods providing a broader trend perspective.
MACD
Moving Average Convergence Divergence (MACD) is a trend-following momentum indicator that shows the relationship between two exponential moving averages (EMAs) of an asset’s price. It consists of the MACD line (12-day EMA - 26-day EMA), a signal line (9-day EMA of MACD), and a histogram. Traders use MACD to identify trend direction, momentum shifts, and potential buy/sell signals when the MACD line crosses above or below the signal line.
Vortex Indicator
The Vortex Indicator (VI) is a trend-following tool used in technical analysis to identify trend direction and reversals. It consists of two lines: +VI (Positive Vortex Line), which measures upward momentum, and -VI (Negative Vortex Line), which tracks downward momentum. A bullish signal occurs when +VI crosses above -VI, indicating an uptrend, while a bearish signal is generated when -VI crosses above +VI, signaling a downtrend.
Outlook
Conclusion
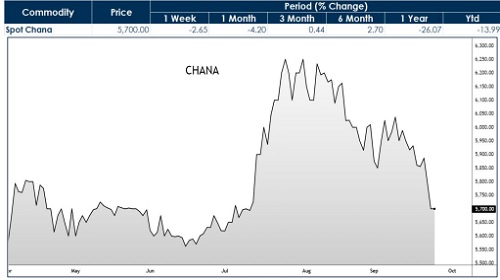
Price Performance: Chana prices dropped over 4% in September to around ?5,700, extending the bearish trend flagged in earlier updates. Despite festive demand expectations, weakness persists as arrivals surged 34.3% YoY (19.13 LMT from Mar–Sep 2025) and inflation for gram eased –9.1% YoY in August, underscoring pressure on prices.
Supply–Demand Balance: Production for 2024–25 is projected at 113.37 LMT, up 2.7% YoY and above recent averages, while procurement fell only modestly to 23.53 LMT. Canadian chickpea carryover stocks (double last year) and fresh supply from Russia/Canada (Oct–Nov), further dilute domestic price strength.
Macro & Policy Drivers: Shifts in consumption toward cheaper pulses (tur, moong, urad) weigh on Chana’s demand. Global pulse prices are easing, creating export competition for India
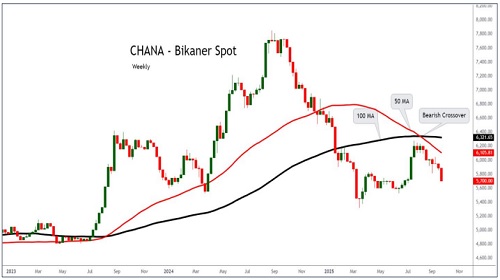
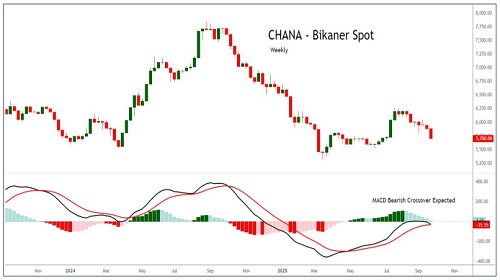
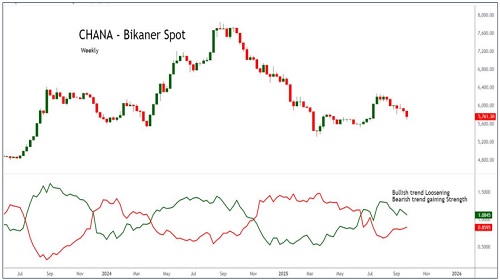
Technical Indicators: RSI at 38.58 continues to weaken, confirming downside momentum. Spot prices remain below the 100 MA with the 50 MA acting as resistance. MACD is below zero with a bearish crossover looming, while the Vortex indicator shows bullish momentum exhaustion. Together, technicals reinforce the negative bias.
Price Outlook
Above views are of the author and not of the website kindly read disclaimer