The Nifty trend deciding level for the day is 16110 - Axis Securities

Follow us Now on Telegram ! Get daily 10 - 12 important updates on Business, Finance and Investment. Join our Telegram Channel
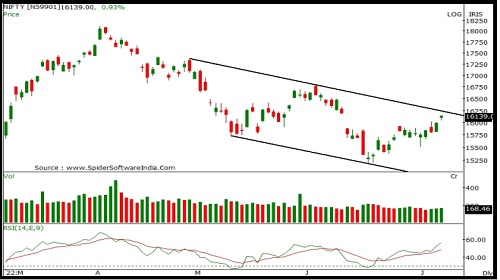
Nifty
Nifty opened with an upward gap and remained in positive terrain throughout the day. Nifty closed at 16133 with a gain of 143 points. On the daily chart index has formed a bullish candle and has closed above its previous session's high representing positive bias ahead. The index is moving in a Higher Top and Higher Bottom formation on the daily chart indicating up trend. The chart pattern suggests that if Nifty crosses and sustains above 16150 level it would witness buying which would lead the index towards 16200-16300 levels. However if the index breaks below 16100 level it would witness selling which would take the index towards 16000-15900. Nifty is trading above its 20 and 50 day SMA which indicates positive bias in the short term. Nifty continues to remain in an uptrend for the short term, so buying on dips continues to be our preferred strategy. The daily strength indicator RSI has turned positive from the oversold territory and is above its reference line indicating positive bias. The trend deciding level for the day is 16110. If NIFTY trades above this level then we may witness a further rally up to 16175-16215-16280 levels. However, if NIFTY trades below 16110 levels then we may see some profit booking initiating in the market, which may correct up to 16070-16005-15965 levels.
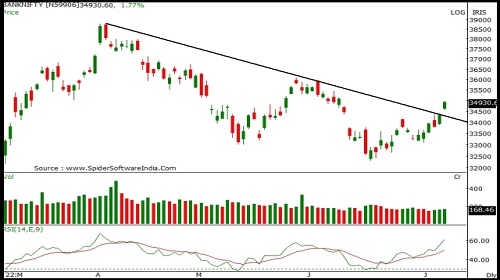
Bank Nifty
Banknifty opened with an upward gap and remained in positive terrain throughout the day. Banknifty closed at 34920 with a gain of 596 points. On the daily chart index has formed a bullish candle and has closed above its previous session's high representing positive bias ahead.The index is moving in a Higher Top and Higher Bottom formation on the daily chart indicating a short term up trend. The chart pattern suggests that if Banknifty crosses and sustains above 35000 level it would witness buying which would lead the index towards 35300-35500 levels. However if the index breaks below 34800 level it would witness selling which would take the index towards 34600-34400. Banknifty is trading above 20 and 50 day SMA indicating positive bias in the short to medium term. Banknifty continues to remain in an uptrend in the short term, so buying on dips continues to be our preferred strategy. The daily strength indicator RSI is moving upwards and is above its reference line indicating positive bias. The trend deciding level for the day is 34815. If BANK NIFTY trades above this level then we may witness a further rally up to 35075-35225-35485 levels. However, if BANK NIFTY trades below 34815 levels then we may see some profit booking initiating in the market, which may correct up to 34660-34400-34250 levels.
To Read Complete Report & Disclaimer Click Here
For More Axis Securities Disclaimer https://simplehai.axisdirect.in/disclaimer-home
SEBI Registration number is INZ000161633
Views express by all participants are for information & academic purpose only. Kindly read disclaimer before referring below views. Click Here For Disclaimer


More News

The bulls lost their grip over the market for the short term - GEPL Capital