The Nifty opened Tuesday’s session with a positive gap 14507- 14618 - ICICI Direct

Follow us Now on Telegram ! Get daily 10 - 12 important updates on Business, Finance and Investment. Join our Telegram Channel
The Nifty opened Tuesday’s session with a positive gap 14507- 14618...
NSE (Nifty): 14845
Technical Outlook
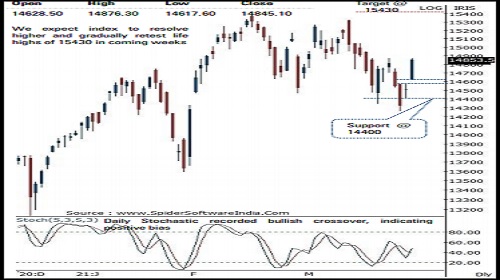
*The Nifty opened Tuesday’s session with a positive gap (14507- 14618) and marched northward throughout the session. As a result, the index formed a sizable bull candle carrying higher high-low, indicating rejuvenation of upward momentum
*Going ahead, we expect the index to resolve higher and gradually retest lifetime highs of 15430 in coming weeks. Key point to highlight is that, despite host of negative news the index managed to hold 14400 twice during past two weeks (on a weekly closing basis), highlighting inherent strength. Subsequently, Tuesday’s swift up move helped the index to decisively close above immediate resistance of 14800 backed by across sector traction, indicating broader market participation. We believe next leg of up move towards 15400 would not be in a linear manner as intermediate pullbacks can not be ruled out. Hence, traders can use volatility to their advantage to build long positions by accumulating quality large cap and midcap stocks
*The broader market indices have formed a higher base above their 50 days EMA coincided with upward sloping trend line, which has been held on multiple occasions since June 2020. Key point to highlight during recent correction is that, the Nifty midcap and small cap indices have maintained the rhythm of not correcting for more than 9-10% since March 2020. In the current scenario, both indices have corrected 9% while sustaining above 50 days EMA. Therefore, we expect both indices to regain upward momentum and eventually outperform the benchmark in coming weeks
*Structurally, we believe extended breather from here on would find its feet around key support zone of 14400, as it is:
*a) 61.8% retracement of post budget rally (13662-15432), at 14338
*b) Despite elevated volatility index majorly held key support of 14400 on weekly closing basis, highlighting strong support base
*In the coming session, we expect the index to trade with a positive bias while maintaining a higher high-low formation. After Tuesday’s sharp up move minor pullback cannot be ruled out. Hence, use intraday dip towards 14845-14870 to create long for target of 14958.
NSE Nifty Daily Candlestick Chart
Nifty Bank: 33875
Technical Outlook
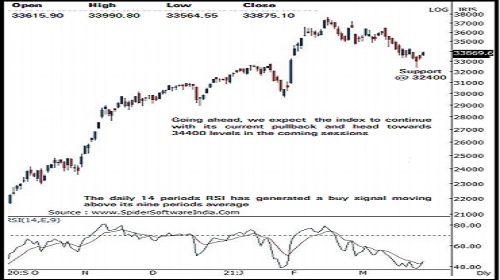
*The daily price action formed a bull candle with a higher high - low signalling continuation of the pullback for a second consecutive session after testing the major breakout area above the yearly high of CY 2019 & CY 2020 on last Thursday session placed around 32500 levels .
*Going ahead , we expect the index to continue with its current pullback and head towards 34400 levels as it is the confluence of the previous week high and 50 % retracement of the last leg of decline (36497 -32415 ) .
*The last six weeks corrective decline has lead to the weekly stochastic placed near the oversold territory with a reading of 23 indicating an impending pullback in the coming weeks . However, the index require to start forming higher high -low in the daily chart on a sustained basis and close above the immediate hurdle of 34400 to signal a resumption of fresh up move
*The major support for the index is currently placed at 32600 - 32400 levels being the confluence of the following technical observations :
a) 61 . 8 % retracement of the previous rally (29687 -37708 ) placed at 32750 levels
b) Major breakout area of previous multiple yearly highs placed around 32500 levels
*In the coming session, the index is likely to open on a flat note amid muted global cues . We expect the index to continue with its last two sessions pullback and continue to form higher high - low . Hence, use intraday dips towards 33780 -33840 to create long position for target of 34070 , maintain a stoploss of 33670
*Among the oscillators the daily 14 periods RSI has generated a buy signal moving above its nine periods average thus supports the continuation of the current pullback in the coming sessions
Nifty Bank Index – Daily Candlestick Chart
To Read Complete Report & Disclaimer Click Here
https://secure.icicidirect.com/Content/StaticData/Disclaimer.html
Views express by all participants are for information & academic purpose only. Kindly read disclaimer before referring below views. Click Here For Disclaimer


Tag News

Stock Picks : TCS Ltd And Chambal Fertiliser Ltd By ICICI Direct