
 320-x-100_uti_gold.jpg" alt="Advertisement">

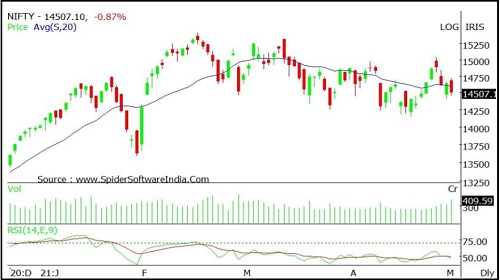
Nifty opened with an upward gap but witnessed selling from the opening tick to end on a negative note - Axis Securities

Follow us Now on Telegram ! Get daily 10 - 12 important updates on Business, Finance and Investment. Join our Telegram Channel
Nifty
Nifty opened with an upward gap but witnessed selling from the opening tick to end on a negative note. Nifty closed at 14497 with a loss of 138 points.
On the daily chart index has formed a bearish candle however it has made a higher high-low indicating positive bias.. The index continues to move in a Lower Top and Lower Bottom formation on the hourly chart indicating negative bias. The chart pattern suggests that if Nifty crosses and sustains above 14600 level it would witness buying which would lead the index towards 14800-15000 levels. However if index breaks below 14450 level it would witness selling which would take the index towards 14400-14250. Nifty is trading below 20 day SMA indicating negative bias in the short to medium term. Nifty continues to remain in an uptrend in the medium and long term, so buying on dips continues to be our preferred strategy
The daily strength indicator RSI has turned negative from the overbought territory and is below its reference line indicating sustained downtrend.
The trend deciding level for the day is 14560. If NIFTY trades above this level then we may witness a further rally up to 14660-14820-14920 levels. However, if NIFTY trades below 14560 levels then we may see some profit booking initiating in the market, which may correct up to 14400-14300-14135 levels
Banknifty
Banknifty opened on a positive note and extended buying momentum in the first half however profit booking in the second half led the index to close on a negative note. Banknifty closed at 32270 with a loss of 195 points.
On the daily chart the index has formed a bearish candle with long upper shadow indicating selling press ure as well as resistance at higher levels. The index continues to move in a Lower Top and Lower Bottom formation on the hourly chart indicating negative bias. The chart pattern suggests that if Banknifty crosses and sustains above 32500 level it would witness buying which would lead the index towards 33000-33500 levels. Important Supports for the day is around 32000 However if index sustains belwo 32000 then it may witness profit booking which would take the index towards 31600-31200 levels.. Banknifty is trading above its 20 day SMA which indicates positive bias in the short term. Banknifty continues to remain in an uptrend in the medium and long term, so buying on dips continues to be our preferred strategy.
The daily strength indicator RSI has turned negative from the overbought territory and is below its reference line indicating sustained downtrend.
The trend deciding level for the day is 32490. If BANK NIFTY trades above this level then we may witness a further rally up to 32790-33310-33610 levels. However, if BANK NIFTY trades below 32490 levels then we may see some profit booking initiating in the market, which may correct up to 31970-31670-31150 levels

To Read Complete Report & Disclaimer Click Here
For More Axis Securities Disclaimer https://simplehai.axisdirect.in/disclaimer-home
SEBI Registration number is INZ000161633
Views express by all participants are for information & academic purpose only. Kindly read disclaimer before referring below views. Click Here For Disclaimer


More News

Despite being hovering within the overbought zone the index has no signs of deceleration of ...


