320-x-100_uti_gold.jpg" alt="Advertisement">

Nifty opened sharply lower with a downward gap and selling pressure throughout the session - Axis Securities

Follow us Now on Telegram ! Get daily 10 - 12 important updates on Business, Finance and Investment. Join our Telegram Channel
Nifty
Nifty opened sharply lower with a downward gap and selling pressure throughout the session dragged it lower to close on a negative note. Nifty closed at 14676 with a loss of 306 points.
On the daily chart the index has formed a big bearish candle and has violated multiple day support of 14700 indicating negative bias.The index continues to move in a Lower Top and Lower Bottom formation on the hourly chart indicating negative bias. The chart pattern suggests that if Nifty breaks and sustains below 14600 level it would witness selling which would lead the index towards 14500-14300 levels. Important Resistances for the day are placed at 14900-15100. Nifty is trading below 20 day SMA indicating negative bias in the short to medium term. Nifty continues to remain in an uptrend in the medium and long term, so buying on dips continues to be our preferred strategy.
The daily strength indicator RSI has turned negative from the overbought territory and is below its reference line indicating sustained downtrend.
The trend deciding level for the day is 14775. If NIFTY trades above this level then we may witness a further rally up to 14910-15150-15285 levels. However, if NIFTY trades below 14775 levels then we may see some profit booking initiating in the market, which may correct up to 14535-14400-14160 levels.

Banknifty
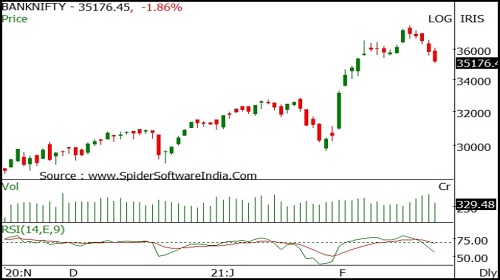
Banknifty opened sharply lower with a downward gap and selling pressure throughout the session dragged it lower to close on a negative note. Banknifty closed at 35257 with a loss of 584 points.
On the daily chart the index has formed a big bearish candle and has violated multiple day support of 35500 indicating negative bias.. The index is moving in a Lower Top and Lower Bottom formation on the daily chart indicating negative bias. The chart pattern suggests that if Banknifty crosses and sustains above 35500 level it would witness buying which would lead the index towards 35800-36200 levels. However if index breaks below 35200 level it would witness selling which would take the index towards 35000-34700. Banknifty is trading above 20 and 50 day SMA's indicating positive bias in the short to medium term. Banknifty continues to remain in an uptrend in the medium and long term, so buying on dips continues to be our preferred strategy.
The daily strength indicator RSI has turned negative from the overbought territory and is below its reference line indicating sustained downtrend.
The trend deciding level for the day is 35495. If BANK NIFTY trades above this level then we may witness a further rally up to 35890-36525-36925 levels. However, if BANK NIFTY trades below 35495 levels then we may see some profit booking initiating in the market, which may correct up to 34860-34465-33830 levels.
To Read Complete Report & Disclaimer Click Here
For More Axis Securities Disclaimer https://simplehai.axisdirect.in/disclaimer-home
SEBI Registration number is INZ000161633
Views express by all participants are for information & academic purpose only. Kindly read disclaimer before referring below views. Click Here For Disclaimer


Top News
Indian shares set to open higher


More News

Market Comment by Mr Shrey Jain, Founder and CEO SAS Online - India's Deep Discount Broker